Corps of Engineers Draft Cumulative Impacts Analysis for 2017 Nationwide Permit 48
Table of Contents
1. Introduction …………………………………………………………………………………………………………………3 2. Proposed Action ……………………………………………………………………………………………………………5
2.1. Nationwide permit 48 …………………………………………………………………………………………….5
2.2. General Conditions ………………………………………………………………………………………………..6
2.3. Regional Conditions ……………………………………………………………………………………………….7
2.4. Description of Work and Activities …………………………………………………………………………….8
2.5. Geographic area …………………………………………………………………………………………………. 39 2.6. Indirect Activities ………………………………………………………………………………………………… 45 3. Effects of the Action ……………………………………………………………………………………………………. 47
3.1. Effects of Individual Activities ………………………………………………………………………………… 47
3.2. Spatial Extent and Frequency of Effects ……………………………………………………………………. 54
3.3. Summary of Primary Effects by Region …………………………………………………………………….. 61 4. Cumulative Impacts …………………………………………………………………………………………………….. 66
4.1. Scope of Analysis ………………………………………………………………………………………………… 68
4.2. Eelgrass …………………………………………………………………………………………………………….. 71
4.3. Pacific sand lance and surf smelt…………………………………………………………………………… 103
5. References ………………………………………………………………………………………………………………. 113
2
1. Introduction
The U.S. Army Corps of Engineers (Corps) issues nationwide permits (NWPs) to authorize activities under Section 404 of the Clean Water Act and Section 10 of the Rivers and Harbors Act of 1899 that will result in no more than minimal individual and cumulative adverse environmental effects. There are currently
50 NWPs. These NWPs were published in the February 21, 2012, issue of the Federal Register (77 FR 10184) and expire on March 18, 2017.
The Corps conducts a NEPA and 404(b)(1) analysis for each NWP at a national level and produces a decision document summarizing the results. The decision document for NWP 48 concludes that there will be no individual or cumulative adverse impacts and that regional analysis will be conducted to ensure impacts will be minimal. Identified adverse impacts will be minimized through the use of regional conditions if necessary.
The decision document also indicates that:
“An important aspect for the NWPs is the emphasis on regional conditions to address differences in aquatic resource functions, services, and values across the nation. All Corps divisions and districts are expected to add regional conditions to the NWPs to enhance protection of the aquatic environment and address local concerns. Division engineers can also revoke an NWP if the use of that NWP results in more than minimal individual and cumulative adverse environmental effects, especially in high value or rare wetlands and other waters. When an NWP is issued or reissued by the Corps, division engineers issue supplemental decision documents that evaluate potential impacts of the NWP at a regional level, and include regional cumulative effects assessments.
Corps divisions and districts also monitor and analyze the cumulative adverse effects of the NWPs, and if warranted, further restrict or prohibit the use of the NWPs to ensure that the NWPs do not authorize activities that result in more than minimal individual and cumulative adverse environmental effects. To the extent practicable, division and district engineers will use regulatory automated information systems and institutional knowledge about the typical adverse effects of activities authorized by NWPs, as well as substantive public comments, to assess the individual and cumulative adverse effects on the aquatic environment resulting from regulated activities.”
The purpose of this analysis is to assess the cumulative effects associated with authorizing activities under the 2017 NWP 48 in the state of Washington. The analysis assumes only limited general conditions on work conducted under the permit as described below. The purpose of conducting the analysis in this manner is to determine whether or not additional regional conditions may be necessary to ensure that only minimal cumulative adverse environmental impacts occur consistent with requirements of the permit and the national Corps decision document referenced above. The cumulative effects analysis is structured consistent with NEPA and 404(b)(1) requirements per Corps regulations. The CEQ (40 C.F.R. § 1508.7) provides the following definition of cumulative effects: “the impact on the environment which results from the incremental impact of the action when added to other past, present, and reasonably foreseeable future actions regardless of what agency (Federal or non-Federal) or person undertakes such other actions.” The CEQ guidance document “Considering Cumulative Effects Under the National Environmental Policy Act” provides the basis for the structure and preparation of the analysis (CEQ 1997).
3
4
2. Proposed Action
2.1. Nationwide permit 48
The proposed action is the administration and implementation of the 2017 version NWP 48 in Washington State. The time period for the action is March 19, 2017 until March 18, 2022 which is the time period 2017 NWP 48 will be in effect.
The text of 2017 NWP 48 is as follows:
Commercial Shellfish Aquaculture Activities. Discharges of dredged or fill material into waters of the United States or structures or work in navigable waters of the United States necessary for new and continuing commercial shellfish aquaculture operations in authorized project areas. For the purposes of this NWP, the project area is the area in which the operator is authorized to conduct commercial shellfish aquaculture activities, as identified through a lease or permit issued by an appropriate state or local government agency, a treaty, or any easement, lease, deed, contract, or other legally binding agreement that establishes an enforceable property interest for the operator. A “new commercial shellfish aquaculture operation” is an operation in a project area where commercial shellfish aquaculture activities have not been conducted during the past 100 years.
This NWP authorizes the installation of buoys, floats, racks, trays, nets, lines, tubes, containers, and other structures into navigable waters of the United States. This NWP also authorizes discharges of dredged or fill material into waters of the United States necessary for shellfish seeding, rearing, cultivating, transplanting, and harvesting activities. Rafts and other floating structures must be securely anchored and clearly marked.
This NWP does not authorize:
- The cultivation of a nonindigenous species unless that species has been previously cultivated in the waterbody;
- The cultivation of an aquatic nuisance species as defined in the Nonindigenous Aquatic Nuisance Prevention and Control Act of 1990;
- Attendant features such as docks, piers, boat ramps, stockpiles, or staging areas, or the deposition of shell material back into waters of the United States as waste; or
- Activities that directly affect more than 1/2-acre of submerged aquatic vegetation beds in project areas that have not been used for commercial shellfish aquaculture activities during the past 100 years.
Notification: The permittee must submit a pre-construction notification to the district engineer if: (1) the activity will include a species that has never been cultivated in the waterbody; or (2) the activity occurs in a project area that has not been used for commercial shellfish aquaculture activities during the past 100 years. If the operator will be conducting commercial shellfish aquaculture activities in multiple contiguous project areas, he or she can either submit one PCN for those contiguous project areas or submit a separate PCN for each project area. (See general condition 32.)
5
In addition to the information required by paragraph (b) of general condition 32, the preconstruction notification must also include the following information: (1) a map showing the boundaries of the project area(s), with latitude and longitude coordinates for each corner of each project area; (2) the name(s) of the species that will be cultivated during the period this NWP is in effect; (3) whether canopy predator nets will be used; (4) whether suspended cultivation techniques will be used; and (5) general water depths in the project area(s) (a detailed survey is not required). No more than one pre-construction notification per project area or group of contiguous project areas should be submitted for the commercial shellfish operation during the effective period of this NWP. The pre-construction notification should describe all species and culture activities the operator expects to undertake in the project area or group of contiguous project areas during the effective period of this NWP. If an operator intends to undertake unanticipated changes to the commercial shellfish aquaculture operation during the effective period of this NWP, and those changes require Department of the Army authorization, the operator must contact the district engineer to request a modification of the NWP verification; a new pre-construction notification does not need to be submitted. (Authorities: Sections 10 and 404)
Note 1: The permittee should notify the applicable U.S. Coast Guard office regarding the project.
Note 2: To prevent introduction of aquatic nuisance species, no material that has been taken from a different waterbody may be reused in the current project area, unless it has been treated in accordance with the applicable regional aquatic nuisance species management plan.
Note 3: The Nonindigenous Aquatic Nuisance Prevention and Control Act of 1990 defines “aquatic nuisance species” as “a nonindigenous species that threatens the diversity or abundance of native species or the ecological stability of infested waters, or commercial, agricultural, aquacultural, or recreational activities dependent on such waters.”
2.2. General Conditions
To qualify for NWP authorization, the prospective permittee must comply with 32 general conditions, as applicable, in addition to any regional or case specific conditions imposed by the division engineer or district engineer.
The general conditions allow for discretion with respect to their applicability (e.g., ‘to the maximum extent practicable’) in most cases or defer to other agencies for additional requirements. In practice it is uncertain whether any of the general conditions would minimize effects of the action. Historically, these conditions have not been invoked to restrict activities under NWP 48. In all cases but one, the cumulative effects analysis assumes no additional requirements placed on the work beyond that described in the action description above. This results in a worst-case environmental effects analysis.
General condition 11 is the one exception whereby it is assumed that all heavy equipment will be transported to work sites by vessel at high tide so as not to impact aquatic areas through the creation of roads in the mudflat or to otherwise disturb the nearshore habitat beyond the project area.
6
2.3. Regional Conditions
For the purpose of this analysis, it is assumed no regional conditions will be applied to the work conducted under the 2017 NWP 48.
7
2.4. Description of Work and Activities
This section describes the range of work and activities that are included within the 2017 NWP 48. The information was gathered from multiple sources including PCSGA (2011; 2013a; 2013b), WDNR (2008; 2013), Corps (2014a) and from knowledge of the professional Corps staff that have been involved in regulating shellfish activities. There is wide variation in the manner in which individual shellfish activities are conducted and the equipment/materials used. The descriptions below are considered generally representative of the individual activities but variability inherent within individual activities is not necessarily captured. The work and activities are summarized in Section 2.4.6. Section 2.5.1 describes the acreage of the work and activities by geographic region. These two components (general description and acreage) together describe the work that would be authorized by the Corps under the proposed action.
2.4.1. Mussel Activities
There are two species of mussels cultured in Washington State marine waters. These include Mytilus trossulus, commonly known as the blue mussel and Mytilus galloprovincialis, commonly known as the Mediterranean or Gallo mussel. The blue mussel is native to Washington State. The mussel activities described below may be performed at any time of day and at any time of year. They are not dependent on season or tides.
2.4.1.1. Rafts, Floats, other Structures, and Surface Longlines
Mussels are typically grown suspended from rafts or surface longlines anchored in subtidal waters, but they can be grown from any structure (e.g., pier) where there is adequate water depth at low tide. A raft is considered an open-framed floating structure with cross beams. Raft platforms are constructed of lumber, aluminum, galvanized steel, and plywood with some form of flotation. Lines with attached mussels are suspended from the raft. There may be multiple rafts for one activity footprint (Figure 2-1).
A float is a floating platform structure, typically rectangular, that is either anchored or attached to a pier or dock. Floats are used as working platforms, storage or for mooring boats. A float can be towed into place for anchoring.
Other structures the Corps would permit under the proposed action are discharge and intake pipes associated with upland wet-storage tanks. These tanks are placed in upland areas and used for holding shellfish species for some period of time. Water is circulated through the tanks via pipes that extend from the tanks to the nearby marine waters. There would typically be pipes for both intake and discharge. The activity must be compliant with Section 402 of the Clean Water Act (National Pollutant Discharge Elimination System (NPDES)) and have an NPDES permit, if necessary, before the Corps would issue a permit or verification under the proposed action. The upland wet-storage tanks themselves and their associated discharge are not within the regulatory jurisdiction of the Corps so would not be permitted under the proposed action.
8
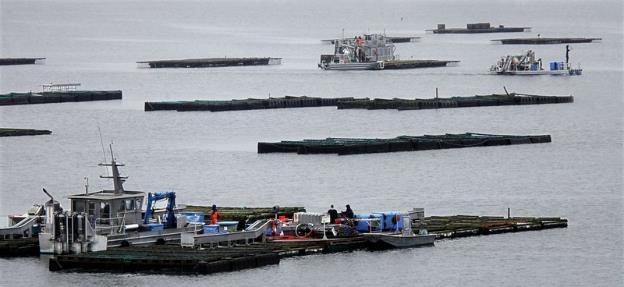
Figure 2-1. Penn Cove Shellfish mussel rafts and harvest barge (Everett Herald 2013)
Surface or floating longlines are typically made of heavy polypropylene or nylon rope suspended by floats or buoys or they could be suspended from a structure such as a pier. They can consist of a single buoy and rope with attached cultured species extending below the buoy and anchored to the substrate. They can consist of multiple buoys connected by rope extending horizontally across the water surface for hundreds of feet. Rope with cultured species would be hung at intervals along this horizontal line. Large anchors to the substrate may also be placed at intervals along the line and at each end.
Seeding and Planting
Naturally-spawned mussel seed are set on lines or metal screen frames in net cages that are suspended in the water during the late spring spawning season. Hatchery seed, when used, is already set on lines or screen frames at the nursery, and then transported to the mussel farm for planting. Once the seed reaches 6 to 12 millimeters long, which can take several months in winter or several weeks in summer, it is scraped from the frames or stripped from the lines and sluiced into polyethylene net sausage-like tubes, called “socks,” each with a strand of line threaded down the length of the sock for strength. A mussel disc may be inserted into the socks at intervals to support the weight of the mussels growing above it. Concrete weights with stainless steel wire hooks are hung on the bottom end of each mussel sock for tension. The socks are then attached to the raft or surface longline (Figure 2-2).
Maintenance and Grow-out
When the mussels reach about 1 inch in length, the weights are often removed from the socks and saved for reuse. Predator exclusion nets are hung around the perimeter of the rafts. Nets may be in place all year or may be used seasonally. If the predator exclusion nets become excessively fouled (e.g., with barnacles, algae, other aquatic vegetation or biological growth), they may be cleaned in place by hand or by mechanical methods. They may also be removed and then cleaned. Fouling organisms may also be removed from the raft structure itself.
9
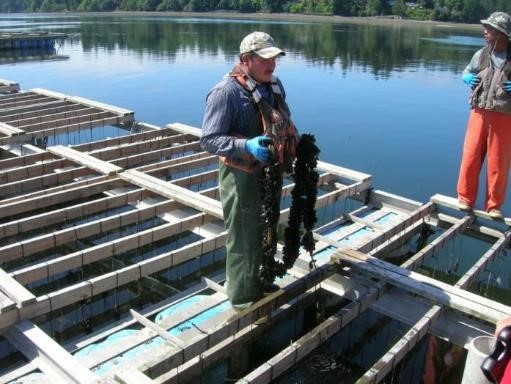
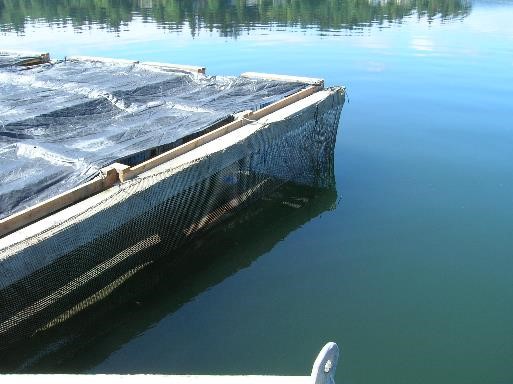
Figure 2-2. Commercial mussel raft in south Puget Sound (Corps site visit 2013)
10
Harvest
When cultured mussels reach market size, about 12 to14 months of age, socks or lines of mussels are removed from the longline or raft for cleaning and grading. Biofouling is typically removed from mussels during harvest as the mussels are cleaned. The waste material is commonly returned to the water or put into a shell pile on shore. The mussels are stripped from the socks and bulk-bagged and tagged for transport to shore. Mussels that fall from the lines onto the predator nets or the bottom substrate may be harvested by hand or by suction dredge. Weights are reclaimed for re-use, and used socking and lines are recycled or disposed of at an appropriate waste facility. Harvesting occurs year round as mussels mature.
2.4.1.2. Mussel Bottom Culture
Mussel bottom culture entails growing mussels directly on the bottom substrate or in/on a container that is supported on the substrate. This may include growing mussels in bags or on trays supported on the substrate as described in the following sections for oyster and clams. Bottom culture could entail harvesting natural set mussels on stakes placed into the substrate or recruited to the substrate directly. The culture and harvest activities are similar to oyster stake and rack and bag culture methods. The reader is referred to the oyster stake and rack and bag sections for more detail on how this activity would be conducted.
2.4.2. Oyster Activities
Several species of oysters are cultured on the West Coast including the Pacific oyster (Crassostrea gigas), Kumamoto oyster (Crassostrea sikamea), Eastern oyster (also known as American oyster) (Crassostrea virginica), European flat oyster (Ostrea edulis), and the Olympia oyster (Ostrea conchaphila). Only the Olympia oyster is native to Washington State.
Oyster ground is often classified or referred to by its use, such as seed ground, grow-out ground, or fattening ground. There are four general strategies for oyster culture which depend on target markets, beach characteristics, and environmental conditions. These strategies include stake culture, rack-andbag culture, bottom culture, and longline culture.
Many oyster activities are performed by workers on foot during low tides that expose the culture bed. The lowest tides occur for a period of several days each lunar month (29 days). During these low tides, workers may be present on the bed for 3 to 6 hours. In this document, work performed during these monthly low tides is described as occurring “during low tide.” Work can occur at any time of the year; although, traditionally, December through January has been a strong market for commercially harvested oysters. Oysters are typically harvested between 18 months and 4 years of age (Corps 2014a).
Oyster activities may also be performed at high tides or in the subtidal zone. These work activities would not be dependent on tides and could occur at any time of the year. Harvest activities may occur at any time.
The oyster activities discussed below all generally use oyster cultch as a basis for the culture. Oyster cultch is oyster shell with attached oyster seed (or spat). Cultch is prepared by bundling washed and aged Pacific oyster shells (“mother shells”) in plastic mesh bags which are then placed in the intertidal zone prior to spawning season. Up to thousands of cultch bags may be required for a single oyster
11
operation. Naturalized seed then collects on the bags of shell which creates the oyster cultch. Stakes with attached shell or ‘hummocks’ of shell placed in intertidal areas may also be used to collect naturalized seed. Alternatively, seeding of the mother shells may occur in an upland hatchery. The cultch bags remain in the intertidal zone, either loose or on pallets, until the seed is large enough or “hard” enough (i.e., firmly cemented onto the mother shell and able to resist predation and desiccation) to withstand being moved onto the culture beds (Figure 2-3).
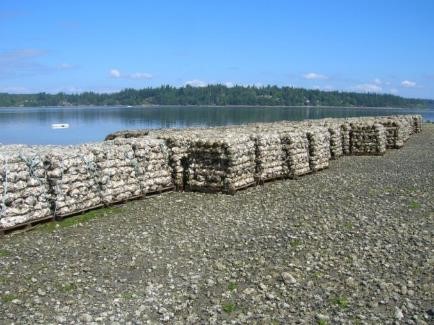
Figure 2-3. Oyster cultch shell with spat stacked on pallets (Corps site visit 2013)
2.4.2.1. Rafts, Floats, FLUPSYs, and other Structures
Oyster activities do not use structures to the same extent as mussel activities. Rafts/floats may be used as work platforms while oyster activities are occurring at a site. These rafts/floats may be anchored to the substrate or attached to a vessel. Rafts and FLUPSY floats may also be used to grow-out seed. A FLUPSY is a type of float structure specifically used for growing out seed to a larger size (Figure 2-4). Because it requires a power connection, FLUPSYs may be placed in the intertidal zone adjacent to power sources, such as attached to a pier. The floating structure continuously draws seawater through the system. Juvenile shellfish, one to two millimeters in length, are transported to a FLUPSY from a shellfish hatchery. The seed is placed in bins with screened bottoms that are lowered into openings in a floating frame and suspended in the seawater. Several bins are placed in a row on either side of a central enclosed channel that ends at a paddlewheel or pump. The wheel or pump draws water out of the central channel creating an inflow of seawater through the bottom of the seed bins, continuously feeding the juvenile shellfish. The outflow from the bins is through a dropped section on one side of the bin facing the central channel. Typically, the FLUPSY platform is equipped with overhead hoists so the bins can be cleaned and moved. Once seed have reached a suitable size, they are removed from the FLUPSY and transplanted to a grow-out site
Trays or bins elevated above the substrate may be used for additional seed grow-out or nursery seed boosting. Trays or bins are affixed to racks set on the substrate. Racks have typically been made of
12
rebar, angle iron, and in rare cases, wood and or plywood. Trays are typically made of plastic. Racks may be deployed for a few months or longer. There may also be use of what are termed “stackable nester trays” for boosting seed. Tidal depths for elevated trays on racks vary from a +3 feet to -15 feet Mean Lower Low Water. Trays or bins may also be placed directly on the substrate (PCSGA 2013a).
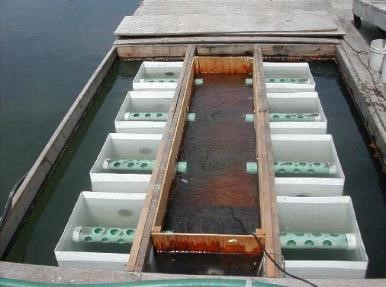
Figure 2-4. A FLUPSY (Fisher Island Oysters 2007 in PCSGA 2011)
Upland wet-storage tanks, as described above for mussel activities, could also be used for oyster activities. The Corps would permit the pipes (for both discharge and intake) associated with these tanks under the proposed action.
2.4.2.2. Oyster Floating Culture
Oyster floating culture occurs using lantern nets, bags, trays, cages, or vertical ropes or wires suspended from surface longlines or rafts similar to that described above for mussels. Floating culture occurs in the subtidal zone. Surface longlines are heavy lines suspended by floats or buoys attached at intervals along the lines, anchored in place at each end. Lantern nets, adopted from Japanese shellfish culture, are stacks of round mesh-covered wire trays enclosed in tough plastic netting. The nets, bags, trays, cages, or vertical ropes or wires are hung from the surface longlines or rafts.
Seeding
Single set oyster seed is placed on the trays or in the bags and suspended in the water. Oyster cultch may be attached directly to the vertical ropes or wires.
Maintenance and Grow-out
Single oysters are regularly sorted and graded throughout the growth cycle. Every three or four months trays are pulled, the stacks taken apart, and oysters are put through a hand or mechanical grading process. The trays are then restocked, stacks rebuilt, de-fouled by removing species such as barnacles, algae and other aquatic vegetation, and returned to the water. Oysters grown directly on vertical lines are in clusters and receive little attention between seeding and harvesting.
13
Harvest
A vessel equipped with davits and winches works along the lines, and the trays, nets or bags are detached from the line one by one and lifted into the vessel. The gear is typically washed as it is pulled aboard. Oysters are removed and placed into tubs where they may be cleaned and sorted.
Oysters grown using floating culture may be transplanted to an intertidal bed for two to four weeks to “harden”. Hardening extends the shelf-life of floating cultured oysters by literally hardening the shell making it less prone to chipping, breakage, and mortality during transport and conditioning them to close their shells tightly when out of the water to retain body fluids. Oysters are re-harvested from the transplanted areas using bottom culture harvest methods. Alternatively, oysters grown by floating culture may be hung from docks at a tidal elevation that results in hardening them.
2.4.2.3. Oyster Bottom Culture
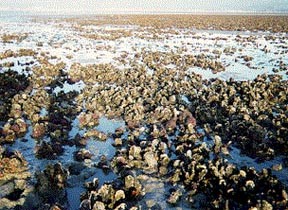
Bottom culture entails growing oysters directly on the substrate in intertidal or shallow subtidal areas (Figure 2-5).
Seeding and Planting
Prior to planting, oyster beds are prepared by removing debris such as driftwood, rocks, and predators (e.g., starfish, oyster drills) by hand or mechanically by dragging a chain or net bag. Any oysters that remain on site from the previous growing cycle may be removed or thinned. In some areas the substrate may occasionally be enhanced with crushed oyster shells often mixed with washed gravel to harden the ground (see discussion of graveling in Section 2.4.3).
Seeding occurs by spraying oyster cultch from the deck of a barge or casting it by hand. In some cases, farms rely solely on the natural set of oyster seed. Oyster hummocks may be created by mounds of oyster shell which provide a substrate more conducive to attracting natural seed (Figure 2-5).
Maintenance and Grow-out
Oysters may be transplanted from one site to another at some point during grow-out. For example, oysters may be moved from an initial growing area to “fattening” grounds with higher levels of nutrients allowing the oysters to grow more rapidly. Oysters may be removed for transplant either by hand or by dredge.
Oysters may sink into the mud in areas where the substrate is soft. When this happens, the oysters are harrowed to pull them up out of the mud. The harrow is a skidder with many tines, towed along the substrate by a boat. The harrow penetrates the substrate by a few inches, breaking up the oyster clusters, and moves the oysters back to the surface. This method is also referred to as “dragging”. Dragging is typically performed during the second or third year of growth. Oyster dredge-harvest vessels are used for dragging by substituting the dredge baskets with drag tools which they hang on the outrigger cables. About five acres can typically be harrowed in one day (Corps 2014a).
Harvest
Harvest typically occurs either by hand during low tide or by dredge. During hand harvest, workers use hand tools or hand-pick oysters and place them into various sized containers placed on the bed (Figure 2-6). Larger containers may be equipped with ropes and buoys that can be lifted with a boom crane
14
onto the deck of a barge at high tide. Smaller containers are sometimes placed or dumped on decks of scows for retrieval at high tide or are carried off the beach at low tide.
Mechanical or dredge harvest occurs by use of a harvest bag that is lowered from a barge or boat by boom crane or hydraulic winch at high tide and pulled along the bottom to scoop up or ‘dredge’ the oysters. The dredge bags have a leading edge (blade) consisting of a steel frame with teeth and a steel mesh collection bag attached to the frame. As the dredge bags are towed across the substrate, the oysters are loosened and guided into the bags. The bag is then hoisted onto the boat deck, emptied, and then redeployed. Two dredge bags may be towed simultaneously off each side of the boat. The boats, such as the one shown in Figure 2-7, can haul large volumes that can weigh over twenty tons. Dredge equipment can typically be adjusted so that the correct depth is dredged as tide levels change.
A given area may be dredged twice in succession to ensure recovery of the maximum number of oysters (Corps 2014a). Harrowing may occur between the two successive dredge events in order to increase recovery of oysters. Alternatively, the area may be hand harvested at low tide after initial dredging to obtain any remaining oysters.
15

Figure 2-5. Oyster bottom culture (top) and hummocks (bottom), Willapa Bay (UW 2015)

Figure 2-6. Hand harvest of oysters, South Puget Sound (Taylor Shellfish 2013)
One crop of oysters is typically dredged twice before actually being harvested. In some case, oysters may be dredged at about one year and then transplanted to a grow-out bed. In other cases, the oysters may not be transplanted to a finishing (fattening) bed until they are closer to harvest size. Dredging can be accomplished at a rate of one acre harvested every two days depending on the time of year and
16
density of oysters (Corps 2014a). In summary, an individual oyster bed may commonly be dredged a total of three times over the plant to harvest cycle.

Figure 2-7. Oyster dredge in Willapa Bay (Bay Center Farms 2015)
2.4.2.4. Oyster Longline Culture
In longline culture, oysters are grown in clusters on rope lines suspended off the bottom (typically 3 feet or less) between upright stakes made of PVC or metal pipe. This method keeps the oysters from sinking into soft substrates and minimizes their exposure to predators. Since the activity is supported by structures placed on the substrate, it is considered a ground-based culture method in this document to differentiate it from the floating or surface longlines discussed previously.
Seeding and Planting
Bed preparation activities are similar to those described above under bottom culture with the following additions. Residual oysters (“drop offs”) dislodged from the lines during the previous growing cycle are typically harvested using bottom culture methods. The substrate may be leveled either manually or by mechanical means to address accumulations of sediment that have occurred since the previous planting cycle. If the PVC or metal stakes were removed after the previous harvest they are replaced by hand. When bed preparation is complete, long polypropylene or nylon lines with a piece of seeded oyster cultch attached approximately every foot are suspended above the ground between the stakes.
Maintenance and Grow-out
The oysters grow in clusters supported by the longlines over a period of 2 to 4 years (Figure 2-8). The longlines are checked periodically during low tides to ensure that they remain secured to the pipe and that the pipe remains in place. Periodic control of fouling organisms (e.g., mussels, barnacles, algae and other aquatic vegetation) and predator species may take place.
17

Figure 2-8. Oyster longline culture, Willapa Bay (Corps site visit 2014).
Harvest
Longline oysters may be harvested by hand or by machine. Hand harvest entails cutting oyster clusters off lines by hand at low tide and placing the clusters in harvest tubs equipped with buoys for retrieval by a vessel with a boom crane or hydraulic hoist at a higher tide. The oysters are then barged to shore. Some smaller operations carry the tubs off the beach by hand.
With mechanical harvesting, buoys are attached at intervals along the lines at low tide. During high tide the buoys are attached to a reel mounted on a vessel that pulls the lines off the stakes and reels them onto the boat. The oyster clusters are cut from the lines and then transported to processing plants or market. Some attached biological material (e.g., barnacles, algae) may incidentally fall off the lines during harvest. The oysters are removed from the lines at the processing facility and the line disposed of as waste material. Barnacles and mussels that remain on the lines are removed and may be re-used for their shell material.
About 5,000 to 7,500 sq. ft. (1/8 acre) can be harvested in one day (Corps 2014a). Pipes are often pulled after harvest and the area then harrowed and dredged to collect the remaining oysters. The ground could then be dragged with a chain or net bag to level it and remove debris before replacing stakes for
18
the next cycle. Alternatively, stakes may remain in place depending on the environmental and substrate conditions.
2.4.2.5. Oyster Stake Culture
Oyster stake culture consists of metal or PVC stakes regularly spaced across the growing site with oysters attached directly to the stakes.
Seeding and Planting
Bed preparation methods are similar to those described above under bottom and longline culture. During low tides, stakes made of hard-surfaced material such as metal or PVC pipe are driven into the ground approximately two feet apart to allow water circulation and easy access at harvest. Stakes are limited to two feet in height to minimize obstruction to boaters.
Stakes can be seeded in upland hatchery setting tanks before being planted in the beds or transported to the site as bare stakes where there is a reliable natural seed set. Bare stakes might be planted during the prior winter to allow barnacles and other organisms to attach to the stakes, increasing the surface area available for setting oyster spat. An alternative method of seeding is to attach one to several pieces of seeded oyster cultch to each stake.
Maintenance and Grow-out
Stakes are left in place throughout a two to four year growing cycle. In areas where natural spawning occurs, multiple year classes of oysters grow on the stakes, with smaller, younger oysters growing on top of older oysters. The area is maintained by periodically checking stakes to ensure they remain upright and by removing fouling organisms (e.g., mussels, barnacles, algae and other aquatic vegetation) and predators. Stakes may be repositioned or replaced as needed. Some oysters may be periodically removed to relieve overcrowding. Oysters that fall from or are knocked off the stakes are harvested periodically by hand. They may be transplanted to firmer ground to improve their condition for harvest at a later time.
Harvest
Oysters are selectively hand harvested during low tide by prying clusters of market-sized oysters from the stakes or removing the stakes entirely. They are placed in containers and either hand carried off the beach or loaded on a boat for transport to shore. Undersized single oysters from the clusters may be transplanted to a special bed for grow-out since they cannot reattach to the stakes. They would then be harvested using bottom culture methods when they reach market size. Market-sized drop-offs that have not settled into the mud are harvested along with those pried from the stakes.
Fouling organisms would typically be dislodged during harvest. Stakes that are removed for reuse would be allowed to dry in an upland location to remove biofouling. Shell material may be stored for reuse.
2.4.2.6. Oyster Rack and/or Bag Culture
Rack and bag or bag culture entails growing oysters within plastic bags or other containers that are placed either directly on the substrate or on racks or lines that suspend the bags above the substrate.
19
Seeding and Planting
Bed preparation methods are similar to those described above for the other oyster culture methods. During low tide, longlines and PVC/metal stakes may be installed on the bed to secure the bags. Wood or metal racks could also be installed to keep the bags off the ground. Racks with legs may be placed directly on the substrate, or supports may be driven into the substrate. Single-set seed or oyster cultch is placed in reusable plastic net bags closed with plastic ties or galvanized metal rings. Bags are attached to the racks, stakes, or lines using reusable plastic or wire ties.
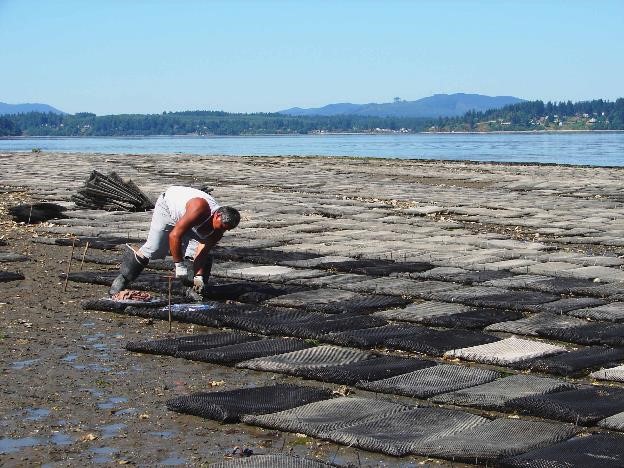
Figure 2-9. Oyster bag culture, south Puget Sound (NOAA Photo as reported in InsideBainbridge 2015)
In some cases, oysters are cultivated using a tumble bag system (Figure 2-10). Oyster tumbling involves attaching a buoy and securing the bags to a single horizontal stainless steel rod held in place by rebar stakes driven into the substrate. The oyster-seed filled bags pivot on the rod and float with the tide. The ebb and flow of the tide agitates the oysters or “tumbles” them.
20
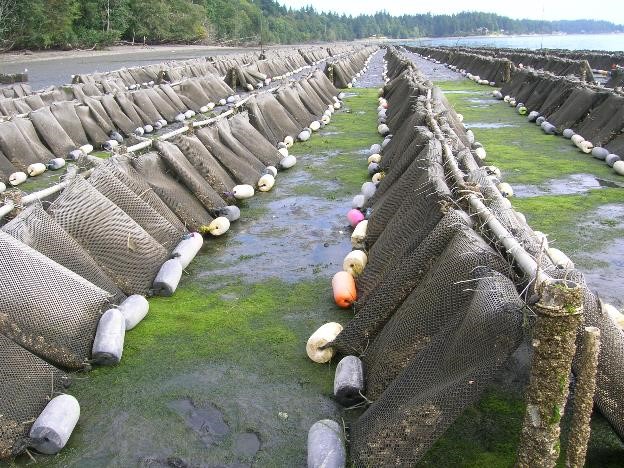
Figure 2-10. Oyster rack and bag tumbling system, South Puget Sound (Corps site visit 2013)
Maintenance and Grow-out
Oysters are left to grow in the bags. The operation is checked periodically during low tides to ensure that the bags remain secure and to remove fouling organisms (e.g., mussels, barnacles, algae and other aquatic vegetation) and predators. Bags may be turned as often as every two weeks to control fouling organisms. Oysters may be periodically redistributed between bags to reduce densities. Oysters may be placed in progressively larger mesh size bags as the oysters grow.
Harvest
Oysters are harvested at low tide by removing the bags from their supports and transferring them to a boat, wheelbarrow, or vehicle for transport to shore. Bags may also be loaded on a boat at higher tides. Biofouling is common on the bags with barnacles and mussels the primary fouling organisms. To removal biofouling, bags are typically placed in upland areas where they are allowed to dry which allows for easier removal of fouling organisms prior to re-use. The activity to ‘dry’ bags typically occurs during the summer months.
21
2.4.3. Clam Activities
Several species of clams are cultured or harvested in Washington State including the littleneck clam (Leukoma staminea), Manila clam (Venerupis philippinarum), butter clam (Saxidomus gigantea), Eastern soft shell clam (Mya arenaria), horse clam (Tresus nuttallii and Tresus capax), razor clam (Siliqua patula), and the cockle (Clinocardium nuttallii). The most commonly cultured clam, the Manila clam, is not native to Washington State.
The following clam activities could occur any time of the year.
2.4.3.1. Rafts, Floats, FLUPSYs, and other Structures
Rafts, floats and FLUPSYs are used less in clam activities than they are in oyster and mussel activities.
Their use for clam culture would be similar to that described above in the mussel and oyster sections.
Upland wet-storage tanks, as described above for mussel activities, could be used for clam activities. The Corps would permit the pipes (for both discharge and intake) associated with these tanks under the proposed action.
2.4.3.2. Clam Bottom Culture
Bottom culture entails growing clams directly on the substrate of intertidal areas.
Seeding and planting
Prior to planting clam seed on the tidelands, beds are prepared in a number of ways depending on the location. Bed preparation activities are similar to those described above for oyster bottom culture. The substrate may be prepared by removing aquatic vegetation, mussels, and other undesired species. Any shellfish present on site may be harvested to reduce competition. These activities could be conducted by hand or by mechanical means (e.g., water jet, harrowing).
Graveling (also called frosting) is a common activity employed for clam culture. This consists of adding gravel and/or shell when the tide is high enough to float a barge. Graveling by vessel often occurs during about a two hour window at slack tide. Applying at the slack tide allows for a more accurate placement of the graveling material. In a 1-2 hour period, about 1 acre can be graveled to a depth of up to 1 inch (Corps 2014a). Several thin layers of material may be placed over a period of days (Figure 2-12). To place a single 0.5-inch layer requires about 70 cubic yards of washed gravel or shell per acre. An individual site would not be graveled more frequently than once per year. Many sites are graveled annually whereas other may be graveled at a lesser frequency.
Clam seed is typically acquired from hatcheries and planted in the spring and early summer. Intertidal trays or bags may be used as nursery systems until seed is of sufficient size to plant. The trays are typically two-foot by two-foot with ¼ inch diameter openings that permit water to flow through. They are employed in stacks of six or seven, and placed in the lower intertidal areas secured with rebar or anchored with sand bags. Clam bags as described in the section on bag culture can also be used to hold clams in a nursery system. Natural spawning and setting of clams also occurs. Clam seed sizes and methods of seeding vary, depending on site-specific factors such as predation and weather conditions. Planting methods include hand-spreading seed at low tide upon bare, exposed substrate; handspreading seed on an incoming tide when the water is approximately four inches deep; hand-spreading
22
seed on an outgoing tide when the water is approximately two to three feet deep; or spreading seed at high tide from a boat.
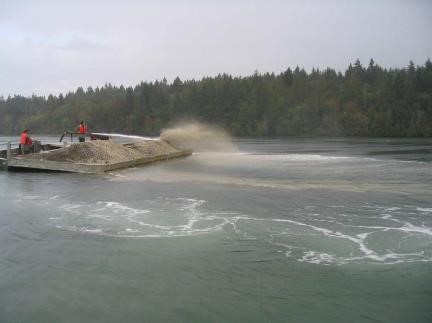
Figure 2-11. Adding gravel to a clam bed (i.e., graveling) (PCSGA 2011)
Immediately after seeding, cover nets may be placed over the seeded areas to protect clams from predators such as crabs and ducks. Cover nets are typically made from plastic such as polypropylene (Figure 2-12). The net edges are typically buried in a trench or weighed with a lead line and secured with rebar stakes. Predator cover netting typically remains on site until harvest.
Maintenance and Grow-out
After each growing season, surveys may be conducted during low tide to assess seed survival and distribution, and to estimate potential yield. Based on survey results, additional seeding activity may occur. Netting used to protect clams from predation can become fouled with barnacles, mussels, aquatic vegetation (e.g., algae, eelgrass) or other organisms. The nets usually remain on site throughout the growing period. Fouling organisms may be removed by hand or by mechanical means while the nets are in place. Depending on local conditions, net cleaning may occur as often as monthly or not at all. Biofouling occurs most frequently during the late spring and summer months.
Harvest
Before harvest begins, bed boundaries may be staked and any predator netting folded back during a low tide. Hand harvesters dig clams during low tides using a clam rake (Figure 2-13). Shovels or other hand operated tools may also be used. Market-size clams (typically about 3 years of age) are selectively harvested, placed in buckets, bagged, tagged, and removed. Undersized clams are returned to beds for future harvests. Since a given clam bed may contain multiple year classes of clams, it may be harvested on a regular schedule (such as annually) to harvest individual year classes of clams. Clams harvested for sale are generally left in net bags in wet storage. Clams are typically maintained in wet storage either directly in marine waters or in upland tanks filled with seawater for at least 24 hours in order to purge
23
sand. Upland tanks are connected to the marine waters through intake and outfall structures (pipes) that are compliant with the NPDES.
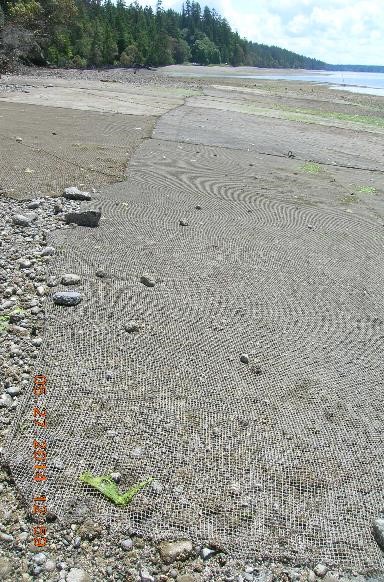
Figure 2-12. Clam cover nets in South Puget Sound (Corps site visit 2014).
Harvesting of clams also occurs with mechanical equipment (Figure 2-14). This equipment is driven on the substrate when the tide is out and excavates the substrate to a depth of about 4-6 inches in order to extract the clams. Clams are harvested after 3 years. About 0.8 acres per day of clams can be mechanically harvested which results in about 12 to 15 days of work for each acre (Corps 2014a). The use of a ‘hydraulic escalator harvester’ equipment is not included among the proposed action activities.
24

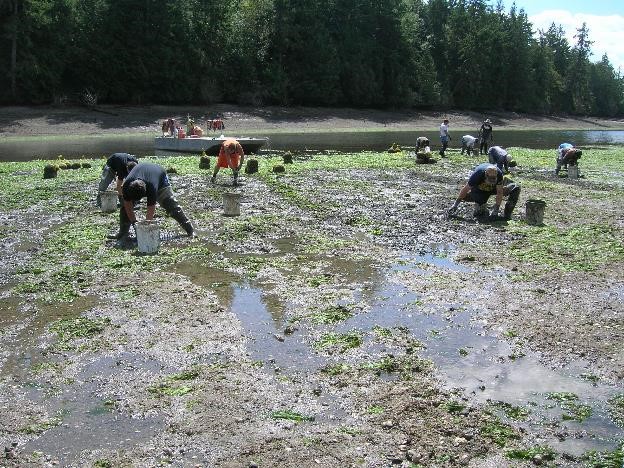
Figure 2-13. Hand harvest of Manila clams (top, Willapa Oysters 2007 in PCSGA 2011; bottom, South Puget Sound, Corps site visit 2013).
25
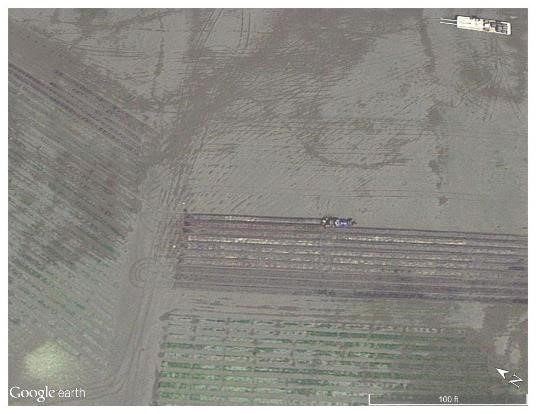
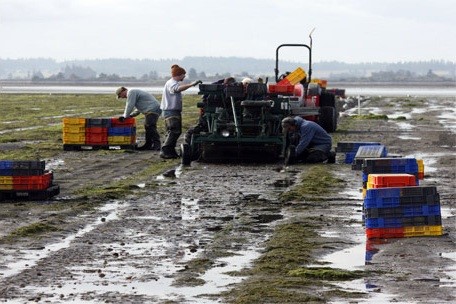
Figure 2-14. Mechanical harvest, low tide in North Puget Sound (GoogleEarth 2015; PSI 2015)
26
2.4.3.3. Clam Bag Culture
Clam bag culture is similar to the bag culture described previously for oysters. Clams are typically grown in plastic mesh bags placed directly on the substrate.
Seeding and Planting
Bed preparation activities are similar to those described above. Prior to setting bags on the tidelands, shallow (typically 2 to 4 inches) trenches may be dug during low tide with rakes or hoes to provide a more secure foundation for setting down the clam bags (Figure 2-13).
Clam seed (typically 5-8 millimeters) is placed in reusable plastic net bags closed with plastic ties or galvanized metal rings. Gravel and/or shell fragments may be added to the bags. Bags may be placed in shallow trenches during low tide and allowed to “silt-in” (i.e., become buried in the substrate). In high current or wind areas, bags may be held in place with 4 to 6 inch metal stakes.

Figure 2-15. Manila clam bags set into, on the substrate (Corps site visit 2013)
Maintenance and Grow-out
Bags are monitored during low tide throughout the grow-out cycle to make sure they remain secured. They may be turned occasionally to optimize growth. Fouling organisms (e.g., mussels, barnacles, algae and other aquatic vegetation) and predators may be periodically removed.
Harvest
When the clams reach market size, the bags are removed from the growing area. Harvesting may occur when there is one to two feet of water, so that sand and mud that accumulated in the bags during growout can be sieved from the bags in place. Bags are transported to a processing site where any added substrate is separated for later reuse.
27
2.4.4. Geoduck Activities
Geoduck (Panopea abrupta) is native to Washington State and is the largest known burrowing clam. Geoduck is a relatively new species for culture. Washington is the principal state in the United States actively farming geoducks. Cultivation under the proposed action would occur between elevation +7 ft to -4.5 ft MLLW. Naturally seeded or wild geoduck could occur from about +1 ft to deeper than -100 ft MLLW.
2.4.4.1. Rafts, Floats, FLUPSYs, and other Structures
The proposed action includes reauthorization and maintenance of currently serviceable rafts, floats, and FLUPSYs that qualify as continuing activities. New rafts, floats, and FLUPSYs or the relocation or expansion of continuing rafts and floats are also included in the action. All of these types of structures have been described above in the mussel, oyster and clam sections.
2.4.4.2. Geoduck Culture Seeding and Planting
Bed preparation activities are similar to those described above. Bed preparation can also include a “preharvest” to remove all current shellfish on the bed including naturally seeded geoduck already present on the site. Undesired species such as sea stars and sand dollars (Clypeasterioda) may be removed by hand. Some growers may attempt to re-locate sand dollars to nearby suitable habitat; other growers remove them permanently from the marine environment.
The most common method of culture currently in use consists of placing a 6-inch diameter, 9-inch long PVC pipe (pipe sizes may vary among growers) by hand into the substrate during low tide, usually leaving the top section of pipe (also called a tube) exposed. Two to four seed clams (usually from hatcheries) are placed in each tube where they burrow into the substrate. Tubes are typically installed into the substrate at a density of about 1 tube per square foot or about 42,000 tubes per acre. The top of each pipe is covered with a plastic mesh net and secured with a rubber band to exclude predators (Figure 2-16). Additional cover netting may be placed over the tube field on beaches with heavy wind and wave action to guard against the tubes becoming dislodged in storms (Figure 2-17). Some growers do not use the individual pipe net covering but use the cover netting to cover the whole field of tubes. Some growers use flexible net tubes (Vexar®) instead of the PVC pipe, which eliminates the need for the additional cover netting. Intertidal geoduck culture typically ranges between the +5.0 and the -4.5 feet tidal elevation (MLLW). Geoduck seed can also be directly set into the substrate without the use of any structure.
Another method being used to exclude predators is net tunnels (Figure 2-18). The tunnels are made from 4-foot wide rolls of polyethylene net placed over a rebar frame to hold the net a couple of inches above the substrate with the net edges buried by the substrate. They are currently being used in the intertidal area. The mesh opening of the net is either 1/4-inch or 3/8-inch. A 24-inch wide net without a rebar frame may also be used.
28
Maintenance and Grow-out
Fouling organisms including mussels, cockle clams, and sand dollars often accumulate inside the tubes. Aquatic vegetation (e.g., algae and eelgrass) may also accumulate on or over the tubes. When this occurs, which could be throughout the year, these fouling organisms are removed.

29
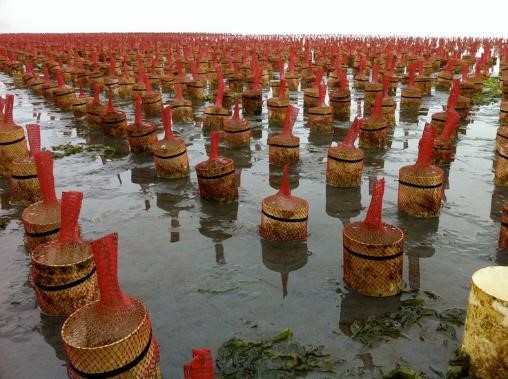
Figure 2-16. Geoduck cultivation using individual tube nets for predator control, South Puget Sound (top, OPB 2012) and Discovery Bay (bottom, Kitsap Sun 2015)

30

Figure 2-17. Cover netting placed over geoduck tubes, South Puget Sound (Corps site visit 2014)

Figure 2-18. Geoduck tunnel net over rebar frame (Dewey 2013)
Tubes and netting are typically removed after 18 months to 2 years when the young clams have buried themselves to a depth sufficient to evade predators (about 14 inches). After tube removal, large area nets may be redeployed over the bed for several months. The tubes and nets are often taken to upland
31
locations and allowed to dry in order to easily remove fouling organisms. They are then typically reused. As the clams grow, they may gradually dislodge the tubes from the substrate before they can be removed. The dislodged tubes could potentially be swept away from the site by the tides.
Harvest
Naturally produced geoducks can live for more than 100 years and may be harvested at any age or size. Cultivated geoducks are typically harvested 4 to 7 years after planting or when they reach about 2 pounds. A site seeded at 160,000 per acre might be expected to produce 32,000 to 40,000 marketable geoduck per acre. The geoducks are harvested in the intertidal zone at low tide (Figure 2-19) or by divers at high tide in the intertidal or subtidal zone. In either case, the geoducks are typically harvested using hand-operated water jet probes. For water jet harvest, the probe is a pipe about 18 to 24 inches long with a nozzle on the end that releases surface-supplied seawater from a 1-inch internal diameter hose at a pressure of about 40 pounds per square inch (about the same pressure as that from a standard garden hose) and a flow of up to 20 gallons per minute.
This harvest method allows the hand extraction of geoducks, which burrow as deep as 3 feet. The harvester inserts the probe in the substrate next to an exposed geoduck siphon or the hole left when the siphon is retracted. By discharging pressurized water around the geoduck, the sediment is loosened and the clam is removed by hand. For the dive harvester, this entire process takes 5 to 10 seconds (Figure 2-20). Each diver carries a mesh bag to collect the harvested geoducks. Divers periodically surface to unload their bags. One diver can harvest 500 to 1,000 geoducks per day. Multiple divers may work in an area at one time. Dive harvesters work no more than 3 to 4 hours per day.
Geoduck harvesting occurs year-round and is not limited by tidal height. However, dive harvesting tends to be the dominant method during winter months (November through February) due to the prevalence of high daytime tides, the absence of suitable low tides for daytime beach harvest, and generally favorable market conditions during that period. Both low-tide and dive harvests may occur on the same sites. It is estimated that the dive harvest is used about 75% of the time compared to the non-dive harvest method (Cheney 2007 referenced in Anchor 2010). Harvest occurs until all harvestable-sized geoduck are removed from the harvest area. Harvesters make several sweeps of a tract to ensure all harvestable-sized geoduck are removed. Because of differences in geoduck growth rates with a mix of harvest-sized and under-sized clams, only a portion of a project area may be harvested, with the remainder set aside for later dive or beach harvest. Additionally, a dive harvest is typically supplemented with beach harvest when clam densities are reduced in the project area. Harvest may also be constrained by tide and current conditions with slow or slack water conditions reducing or restricting the ability to effectively harvest with divers.
32

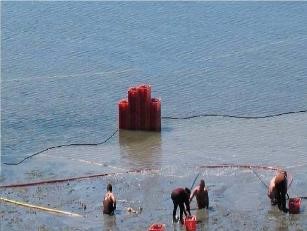
Figure 2-19. Harvesting geoduck at low tide (PCSGA 2011, CPPSH 2015)
Dive harvest is the typical method used for harvesting subtidal geoducks. Dive harvesters work within an approximate 100-foot range from the harvest vessel, or to the maximum lengths of their air and water lines. Intakes for supplying water to the onboard pumps are positioned several feet below the water surface. Intakes will be screened per Conservation Measure.
2.4.5. Vessel and Vehicle Support
Various types of vessels and vehicles could be used to support activities for all shellfish species. Vessels could include offshore rafts, small open crafts with outboard motors, and larger barges (Table 2-1). Land vehicles (e.g., trucks, ATV) could also be used to support the various activities. Use of support vessels would be within the immediate shellfish activity area or the immediate vicinity.
Vessels could be used to mechanically harvest, tow harrow, prepare or maintain the substrate (e.g., graveling). Vehicles may be used on the culture beds as a base of operations and to transport equipment and shellfish. Vehicles can also be used to mechanically harvest or prepare the substrate for harvest (Figure 2-14). This could include tractors harrowing/tilling the substrate.
Geoduck dive harvesters work from small surface vessels or dive platforms that contain machinery for surface-supplied diver air and water jets, diver communication equipment, and on-deck storage for harvested geoducks. Dive boats used to harvest cultivated geoduck may be anchored over the harvest sites and moved to deeper water during low tides. Dive boats used to harvest subtidal geoduck typically move over the harvest area as needed to adjust the divers’ position relative to geoduck density.
Information on vessel sizes have has been provided by PCSGA which is expected to be representative of the range of support vessels that would be used for the various types of activities described above.
33
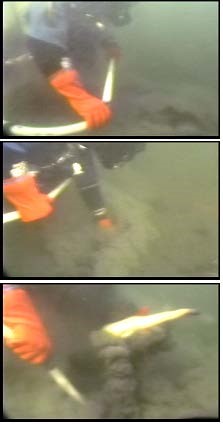
Figure 2-20. Geoduck dive harvest sequence (Anchor 2010)
34
Table 2-1. Types of support vessels and equipment used while conducting work and activities under NWP 48 and estimated in-air noise (PCSGA 2013b).
|
Equipment |
Purpose |
Estimated dBA |
|
5hp motor with propeller |
FLUPSY |
65@100 yards |
|
10hp engine |
skiffs, water pumps, hatchery intake |
65 @ 100 yards |
|
40-330hp engine |
boat inboard/outboard |
65-90 @ 0.5 m |
|
air compressor |
diving |
77-85 @ 7m |
|
power washer (4000 psi) |
nursery raft/FLUPSY |
<100 @ operator ear (~3 feet) |
|
electric hoist |
lifting nursery raft/FLUPSY |
75-85 @ 50 ft |
|
crane |
lifting nursery raft/FLUPSY |
81 @ 50 ft |
|
harvester (6 cylinder Chevy Vortec engine) |
harvesting clams |
60-90 @ 15 m |
2.4.6. Summary of Activities
The activities are summarized below in Table 2-2. This summary may not necessarily list all the activities described in the previous sections.
Table 2-2. Summary of shellfish activities included within the proposed action.
|
Species |
2017 NWP 48 Work and Activities |
||
|
Mussel
Blue, Gallo |
Seeding/ Planting |
• • |
Raft, floats, and their associated maintenance Set lines or metal screen frames in net cages suspended in water to naturally set seed. |
|
|
• |
Install socks weighted and lashed to rafts, lines, or stakes and suspended in water for hatchery-raised seed. |
|
|
• |
Place buoys or anchors used to mark and secure structures |
||
|
Maintenance / Grow-out |
• • |
Placement/maintenance of predator exclusion nets Replace and maintain stakes and lines |
|
|
• |
Remove biofouling and weights |
||
|
• |
Monitor growth |
||
|
Harvest/ Processing
|
• • |
Strip mussels from the lines or socks Bag mussels for transport |
|
|
• |
Intake or outfall structures (pipes) (discharge compliant with NPDES) to connect upland wet storage holding tanks |
||
|
Oyster
|
Seeding/ Planting |
• • |
Raft, floats, and FLUPSYs and associated maintenance Prepare substrate by removal of debris (rocks/large wood) |
35
|
Species |
2017 NWP 48 Work and Activities |
||
|
Pacific, Olympia, Kumamoto, Eastern, European flat |
• • • • |
Remove/relocate undesired aquatic species Application of gravel/shell to firm substrate (sprayed from vessel, or delivered with land vehicle and mechanically or hand deposited). Mechanically level substrate Use of ‘continuing’ seed floats |
|
|
• |
Use of work floats |
||
|
• |
Use of racks/elevated trays or bins |
||
|
• |
Create oyster hummocks (oyster shell mounds) |
||
|
• |
Install bags of cultch material onto stakes, lines, racks, trays or secured directly onto substrate |
||
|
• |
Suspend lantern nets, bags, cages, vertical ropes or wires from surface longlines, or ‘continuing’ rafts |
||
|
Maintenance / Grow-out |
• • |
Continued removal of debris/aquatic species, as necessary Flip/turn bags |
|
|
• |
Re-position stakes |
||
|
• |
Remove excess biofouling |
||
|
• |
Harrow to lift excess mud or sand/re-level substrate |
||
|
• |
Pull and restack trays |
||
|
Harvest/ Processing |
• • |
Hand harvest into containers for transport Mechanical shallow depth dredging from barges |
|
|
• |
Collection and transport of oysters to ‘fattening’ beds to harden (2nd harvest then occurs) |
||
|
• |
Wet storage (in-water) |
||
|
• |
Use of work platforms |
||
|
• |
Intake or outfall structures (pipes) (discharge compliant with NPDES) to connect upland wet storage holding tanks |
||
|
Clam
Manila, littleneck, butter, eastern soft shell, horse, razor, cockle |
Seeding/ Planting |
• • • • • • |
Raft, floats, and FLUPSYs and associated maintenance Use of seed grow-out trays and bins Prepare substrate by removal of debris (rocks/large wood) Remove/re-locate other aquatic species (starfish, vegetation) Application of gravel/shell to firm substrate (sprayed from vessel, or delivered with land vehicle and mechanically or hand deposited). Placing secured nets on the substrate |
|
• |
Applying seed from vessel/vehicle or from foot |
||
|
• |
Place secured or trenched-in net bags |
||
36
|
Species |
2017 NWP 48 Work and Activities |
||
|
Maintenance / Grow-out |
• • |
Continued removal of debris/aquatic species, as necessary Repositioning/cleaning nets to remove debris/biofouling |
|
|
• |
Turning bags |
||
|
Harvest/ Processing |
• • |
Hand digging/bag removal Mechanical harvest |
|
|
Geoduck
|
Seeding/ Planting |
• • |
Raft, floats, and FLUPSYs and associated maintenance Use of seed grow-out trays and bins |
|
• |
Prepare substrate by removal of debris (rocks/large wood) |
||
|
• |
Remove/re-locate undesired aquatic species |
||
|
• |
Install PVC tubes with individual net covers or flexible net tubes |
||
|
• |
Install secured area net covers |
||
|
• |
Install secured net tunnels |
||
|
Maintenance / Grow-out |
• • |
Clean tubes to remove debris/biofouling Remove tubes/nets (area nets may be reset after tubes removed) |
|
|
Harvest/ Processing |
• • |
Harvest by hand (low tide, high tide, and subtidal by divers) Use of pressured water to liquefy substrate |
|
|
All species |
|
• |
Use of work platforms |
|
• |
Vessel support (grounding/anchoring) |
||
|
• |
Land vehicle/foot support to and from uplands to transport equipment, material, shellfish, and people |
2.4.7. Activities Specifically Excluded
Certain shellfish activities (Table 2-3) are excluded from the proposed action for various reasons including:
- Activity extends sufficiently beyond the jurisdiction of the Corps regulatory program and/or is regulated by another Federal agency (e.g., upland hatcheries, NPDES discharge, pesticide use).
- Any unauthorized activity (e.g., not permitted) is not included in the action.
Table 2-3. List of NWP 48 excluded work and activities
|
Excluded Work and Activities |
|
Vertical fencing/vertical nets or drift fences (includes oyster corrals; does not apply to raft nets) |
37
|
New berms or dikes or the expansion or maintenance of current, authorized berms or dikes |
|
Pile driving |
|
Installation and maintenance of mooring buoys |
|
Construction, maintenance, and operation of upland hatcheries |
|
Cultivation of invasive species |
|
Construction, maintenance, and operation of attendant features, such as docks, piers, boat ramps, stockpiles, or staging areas |
|
Deposition of shell material back into waters of the United States as waste |
|
Dredging or creating channels (e.g., placing sand bags) so as to redirect fresh water flow |
|
Any form of chemical application to control undesired species (e.g., non-native eelgrass Zostera japonica, burrowing shrimp) |
|
The use of materials that lack structural integrity in the marine environment (e.g. plastic children’s wading pools, unencapsulated Styrofoam®). |
|
Unauthorized activities |
38
2.5. Geographic area
The geographic area of the action is the nearshore coastal and inland marine waters of Washington
State. This includes Washington coastal beaches, coastal embayments (e.g. Willapa Bay and Grays Harbor), the Strait of Juan de Fuca, and the Puget Sound/Salish Sea (see Figure 1). Work is only expected to occur in the shallow nearshore marine and brackish waters. No work is anticipated in freshwater. Negligible use of NWP 48 is expected in the Columbia River and along the Washington coastal beaches due to the lack of historical shellfish aquaculture in these locations, and the anticipated continued lack of aquaculture in the future. Since work under NWP 48 is not anticipated in the Columbia River estuary, coastal beaches, or in freshwater or upland areas, these geographic areas are not analyzed or discussed in the context of cumulative effects.
39

Figure 2-21. Geographic area and sub-regions of action
40
2.5.1. Acreage
The 2017 NWP 48 authorizes project areas for shellfish aquaculture. In the state of Washington project areas can be privately owned real estate parcels with the area delineated by a deed or a leased area that is delineated by the lease. A project area need not necessarily be entirely engaged in aquaculture but may include active culture areas, fallow areas, or areas that have never or will never be engaged in aquaculture. Project areas can be either continuing/ongoing if there has been aquaculture somewhere within the project area during the last 100 years or a project area can be new to aquaculture. Table 2-5 summarizes the anticipated total acreage that will be permitted under 2017 NWP 48 for continuing and new project areas by geographic area. This includes all project area acreage that was permitted under 2012 NWP 48 which is expected to be reauthorized under 2017 NWP 48 and anticipated new project area acreage. Continuing acreage includes all acreage that has been permitted to date under the 2012 NWP 48 and all known pending acreage. Since not all permit applications for 2012 NWP 48 have been received and some pending applications have not identified acreage, not all continuing acreage is known. The continuing acreage in Table 2-5 was therefore rounded up to account for this unknown acreage.
In order to determine the scale of shellfish activity conducted under the proposed action, the Corps developed an estimate for the total project area acreage that is expected to be authorized by 2017 NWP
48. Estimates for the amount of acreage that could be authorized under the proposed action are provided by geographic region.
The acreage estimates are based on many factors including historical Corps permit applications, estimates provided by commercial shellfish growers for future aquaculture production, coordination with the Washington Department of Natural Resources (WDNR) and their potential shellfish activities, and the general knowledge and expertise of the Corps professional staff that have processed shellfish related permit applications.
For the purpose of categorizing acreages, the activities have been subdivided into floating culture (i.e., with floating lines or rafts) and ground-based culture which includes all other activities including oyster longline culture. Based on analysis of permit applications, there are a total of 934 ongoing/existing project areas. Of these, a total of 927 include ground-based activities conducted in the intertidal or adjacent shallow subtidal areas. The remaining seven activity footprints are for floating culture with rafts exclusively. Five of the continuing activities include both raft and ground-based culture.
Floating aquaculture
Analysis of historical permit applications indicates that floating aquaculture activities occur in Willapa Bay, Hood Canal, South Puget Sound and North Puget Sound. There are a total of twelve continuing active footprints with rafts that cover 87 acres. It is estimated that an additional 100 acres of new floating acreage could be authorized under the 2017 NWP 48. New surface or floating longlines would be authorized under the proposed action. There are a total of 22 continuing active and 32 continuing fallow acres with surface longlines. New floating acres are estimates based on coordination with the shellfish industry and Corps professional judgment.
41
Ground-based aquaculture
Ground-based commercial aquaculture encompasses all of the activities discussed in Section 2 except for the floating activities using rafts. The anticipated acreage for these activities includes both continuing and new activities (Error! Reference source not found.). The acreage for the continuing activities was collected from permit applications that are maintained by the Corps. The geographic locations for each of the continuing activity footprints are illustrated in Appendix D.
The total acreage for new activities is estimated based on projections provided to the Corps by the aquaculture industry, the historical rate of permit applications, and the experience of Corps professional staff.
The vast majority of the ground-based commercial aquaculture and all new activities would occur at tidal elevations between – 4.5 ft and +7 ft MLLW. It is probable that some percentage of this total acreage would be authorized (or reauthorized) at subtidal elevations (i.e., deeper than – 4.5 ft MLLW). This would typically be shallow subtidal lands immediately adjacent to intertidal shellfish activity areas. Based on an analysis of historical permit applications, 22 acres of subtidal lands were previously authorized as continuing shellfish activities. Because permit applicants have not historically been required to delineate their project footprints by tidal elevation, this total likely underestimates the subtidal acreage of continuing shellfish activity. This conclusion is supported by Corps professional staff knowledge of many of the continuing shellfish activity areas. Analysis of aquatic parcel maps and the Corps geographic database also indicates that greater than 22 acres of subtidal lands have likely been previously authorized. WDNR has indicated all but 1,085 acres of marine bedlands (i.e., deeper than extreme low tide) in the State of Washington are owned by WDNR, and WDNR does not lease these lands for ground-based aquaculture currently (WDNR 2013a). WDNR does lease subtidal lands for floating raft aquaculture activities. Because public subtidal lands would not be used for ground-based aquaculture, these 1,085 acres would be considered the maximum amount of subtidal acreage available for ground-based commercial aquaculture. This would constitute less than 3% of the total continuing commercial acreage. These unknown subtidal acres are included in the totals for ground-based activities.
The vast majority of acreage for commercial aquaculture is for activities that are ongoing. Since these activities represent the majority of all shellfish activity potentially authorized under the proposed action, an evaluation of this information is useful for understanding the action and its effects. It is anticipated that all of the ongoing activities would be reauthorized by the Corps under the 2017 NWP 48. A detailed summary of the shellfish activities proposed by historical permit applicants can be found in Appendix B. A summary of the species cultivated by ground based methods can be found in Table 2-4. The table does not include a small amount of mussel bottom culture. The predominant species cultured varies by geographic region. On an acreage basis, the most commonly cultured species appears to be oyster followed by non-geoduck clams.
42
Table 2-4. Distribution of ground-based commercial aquaculture continuing footprints and acreage by species cultivated

43
Summary of NWP 48 acreage
The total potential commercial aquaculture acreage that would be authorized by geographic region is illustrated in Table 2-5.
Table 2-5. Total acreage by project area authorized under 2017 NWP 48 (2017 to 2022)
|
Project area acreage |
Grays Harbor |
Willapa Bay |
Hood Canal |
South Puget Sound |
North Puget Sound |
Total |
|
Continuing/ongoing |
3,846 |
36,315 |
1,820 |
3,648 |
3,946 |
49,576 |
|
New |
24 |
19 |
105 |
106 |
78 |
332 |
|
Total (estimated) |
4,000 |
40,000 |
2,000 |
4,000 |
5,000 |
55,000 |
Many project areas include fallow acreage or acreage that has never been engaged in aquaculture. This acreage is summarized in Table 2-6. For the purpose of this analysis it is assumed this acreage will be put into aquaculture because it will be authorized for that purpose. In this respect it is similar to a new project area but is not encumbered by the restrictions that come with a new project area (e.g., maximum of ½ acre aquatic vegetation impact).
Table 2-6. Existing project area acreage that is known to be fallow (as of 2012) or was never engaged in aquaculture.
|
|
Grays Harbor |
Willapa Bay |
Hood Canal |
South Puget Sound |
North Puget Sound |
Total |
|
Fallow |
1,820 |
9,441 |
410 |
787 |
2,333 |
14,792 |
|
Never in culture |
333 |
272 |
53 |
326 |
280 |
1,265 |
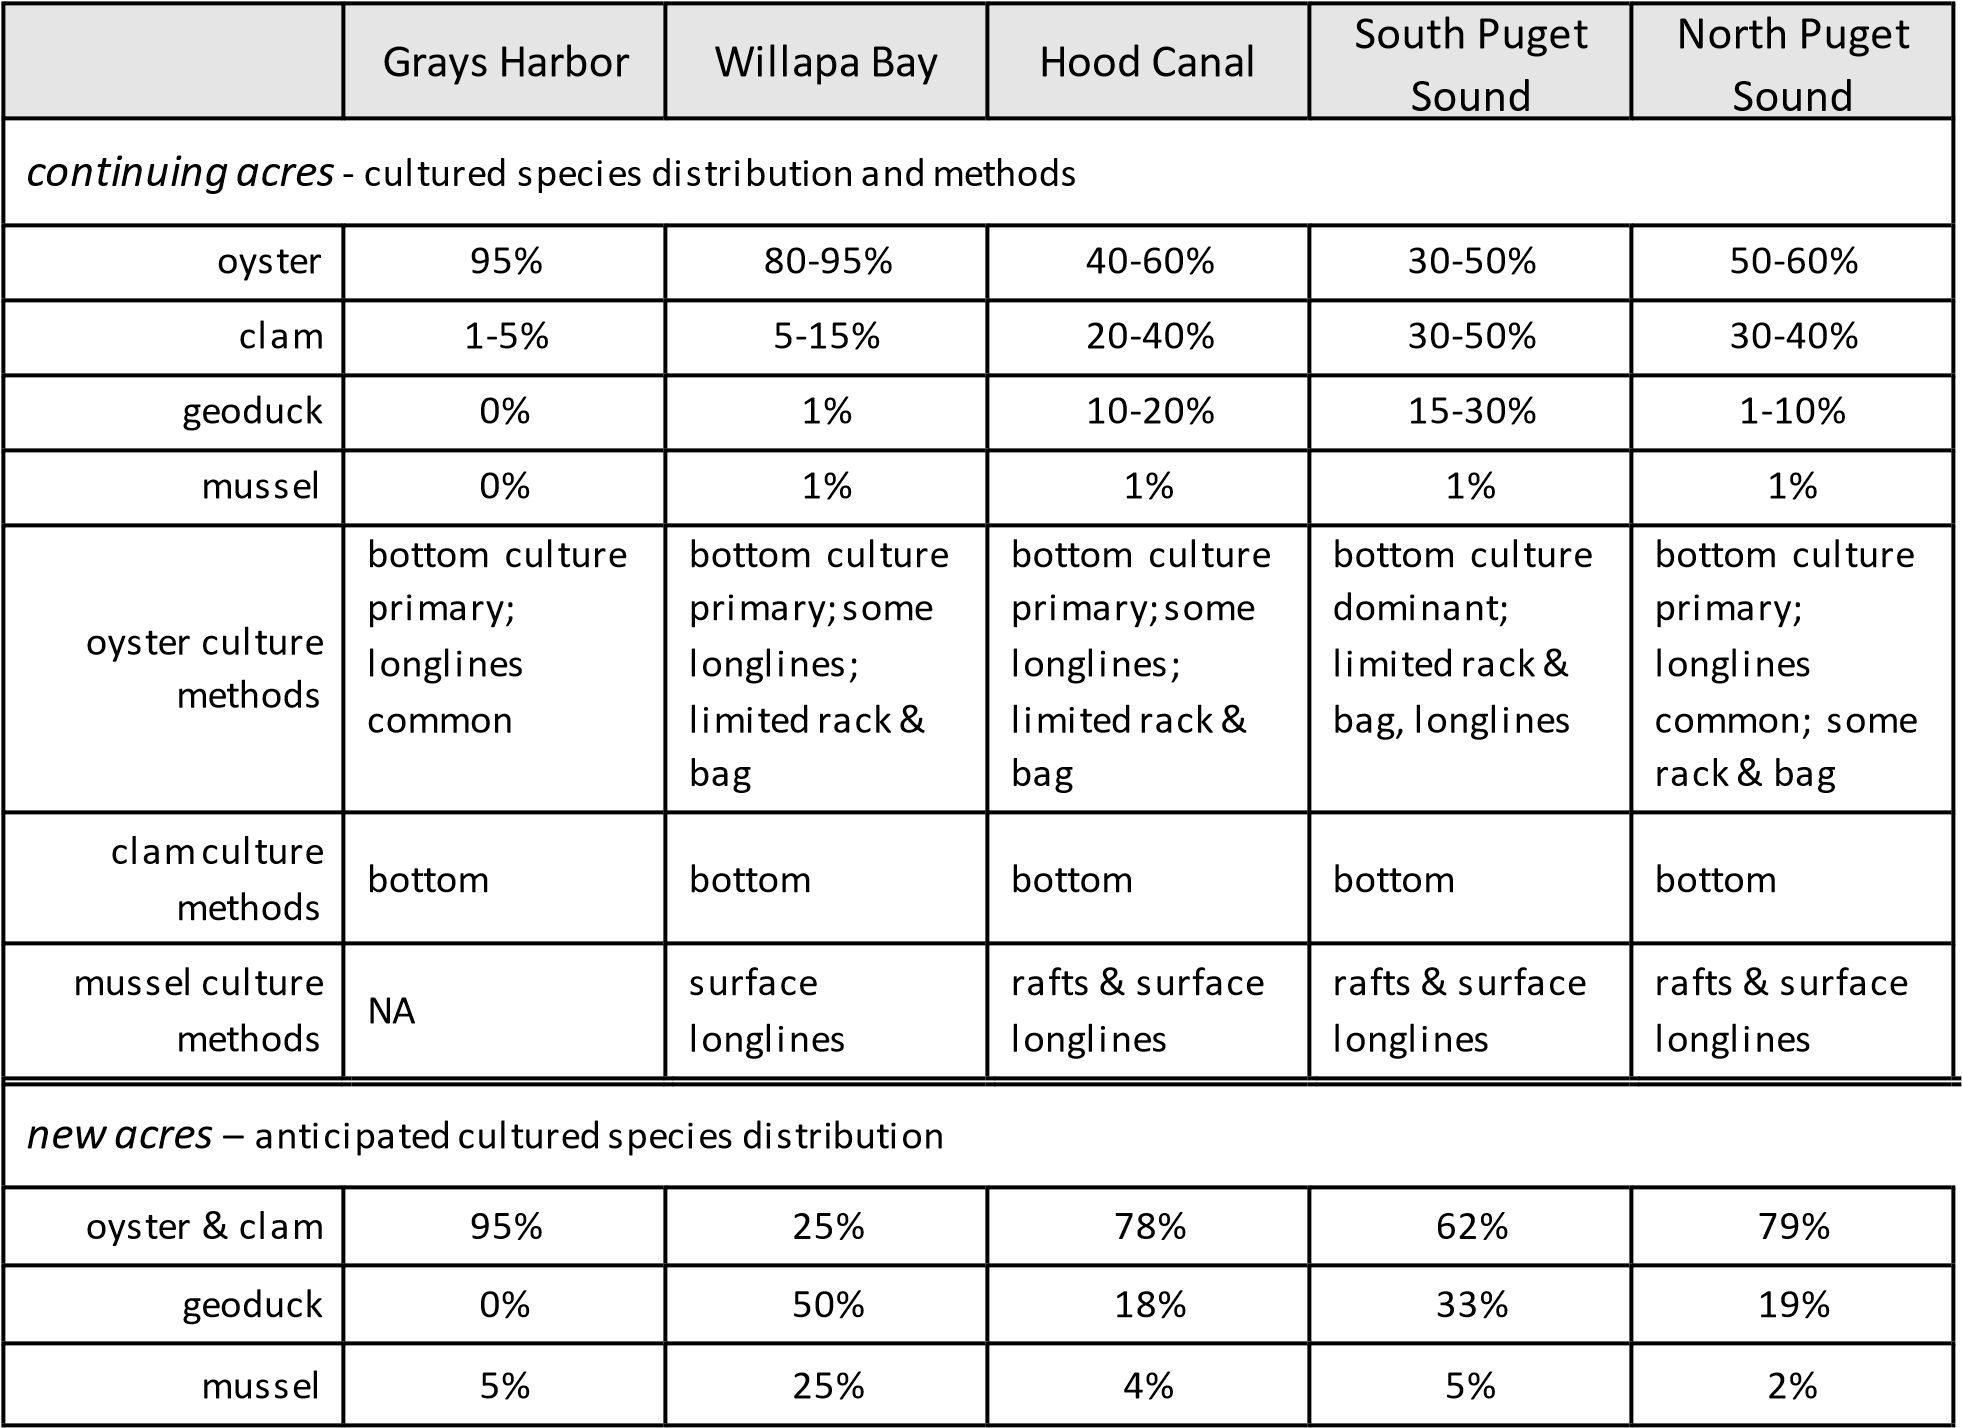
Oyster culture methods vary by region. The ground culture method is by far the dominant method used for clams in all regions. A summary of primary culture methods and an estimate for the relative distribution of species cultured by region is illustrated in Table 2-7. The estimate is based on the information in Appendix B and Table 2-4.
This estimate is consistent with the PCSGA estimate of 300 acres currently used for geoduck culture in the Puget Sound and Hood Canal regions (PCSGA 2013a).
In order to evaluate effects of the action, the acreage for specific categories of activities and their geographic locations are described. This includes discussion of the prevalence of the various culture methods.
44
Table 2-7. Distribution of species cultivated and primary cultivation methods
2.6. Indirect Activities
2.6.1. Vessel and Vehicle Traffic
Vessel (boat/barge), vehicle (e.g., trucks, ATV), or foot traffic related to the transportation of people and materials to and from activity areas occurs in many, if not all, cases. Vessels could land on the shoreline and load or unload items to waiting vehicles or to individual persons who could then carry these items to an upland destination. Vehicle traffic could occur to and from shellfish activity areas directly along shorelines without any dock or pier. Vehicles could be traveling directly on the substrate (i.e., mudflats) to a proximate upland destination. The distinction between the interdependent vessel and vehicle traffic and the support activity described in Section 2.4.5 is the proximity to the shellfish activity area. In most cases, vessel traffic is anticipated to occur from the shellfish activity areas to a local pier, dock, or to the shoreline directly such as to a local beach. In some cases vessel traffic could occur from activity areas to a more distant destination (e.g., to deliver product to market).
45
2.6.2. Upland Storage Sites
Upland locations used for storing equipment, materials (e.g., shell), or maintaining live product in tanks (e.g., wet storage) could occur in close proximity to shellfish activity areas. These upland locations are in many cases interdependent with the shellfish activity area. The use and management of upland storage locations in close proximity to shellfish activity areas are considered to be interdependent with the proposed action. Disturbance (e.g., of native riparian vegetation) in such upland areas shall be minimized consistent with the Conservation Measures.
2.6.3. Shore Facilities
Shore facilities such as hatcheries and processing plants are typically used in coordination shellfish activities but are not regulated by the Corps.
2.6.4. Pesticide Application
The application of the pesticide carbaryl to aquatic lands in Willapa Bay and Grays Harbor has occurred since the 1960s to control burrowing shrimp species (ghost shrimp Neotrypaea californiensis and mud shrimp Upogebia pugettensis). Pesticide use is not universal to all applicants. It is dependent on environmental conditions and other factors associated with individual project areas and applicants. Pesticides are regulated under section 402 of the CWA which is administered by the Washington State Department of Ecology with EPA oversight. In recent years this activity has received significant scrutiny due to its environmental effects. In 2015 WDOE approved the application of Imidacloprid on 2000 acres in Willapa Bay and Grays Harbor. The applicants subsequently requested WDOE cancel the permit in response to public concerns. A new permit application was received by WDOE in 2016 to apply imidacloprid, a neonicotinoid pesticide, on 485 acres in Willapa Bay and 15 acres in Grays Harbor. The earliest this work could occur is 2018. No pesticides would be applied in 2017. WDOE has preliminarily determined that the proposal will have significant adverse environmental impacts under the State Environmental Policy Act. At this time it is uncertain whether the application will be approved (Rockett 2017 pers comm).
46
3. Effects of the Action
Aquaculture consists of a collection of individual activities that each have their own effects. These effects may be relatively short-term or longer lasting. The effects of these individual activities are discussed below. Of equal or more relevance to ESA listed species are the effects of the collective activities, their frequency, duration, timing, geographic location, and general scale across the landscape.
The frequency and geographic scale of the activities are discussed Section 3.2.
3.1. Effects of Individual Activities
The effects described below are written from the perspective of a worst-case effects scenario relative to issues such as work timing and husbandry practices. The purpose of this approach is to ensure the full range of possible effects is discussed. A brief summary of these effects is provided in Table 3-1 for the culture methods and many of the individual activities.
3.1.1. Water Quality
Bivalves themselves remove phytoplankton and suspended particles from the water column. High densities of bivalves that occur with aquaculture can locally decrease phytoplankton, nutrients, and suspended material increasing water clarity (WDNR 2014b; Straus et al. 2013; Heffernan 1999; Newel 2004). Wastes from the cultured species are excreted into the water column and ultimately settle to nearby sediments.
Many of the shellfish activities (e.g., dredging, dive harvest) physically disturb the substrate which results in localized turbidity, increases in suspended sediment, and potentially changes in other water quality parameters such as lower dissolved oxygen (Mercaldo-Allen and Goldberg 2011, Heffernan 1999). These water quality effects may be delayed for activities conducted at low tide ‘in the dry’ until the tide floods the area. There may be a turbidity plume emanating from the actively worked area at low tide for some activities such as intertidal geoduck harvest. In-water activities such as dredging and dive harvest may affect water quality during the period of activity and a short period afterwards. These effects on water quality are temporary and not expected to persist longer than a period of hours or days (Mercaldo-Allen and Goldberg 2011).
3.1.2. Substrate and Sediments
Physical disturbance of the substrate can occur as a result of anchors placed for rafts or surface longlines, from bed preparation activities (e.g., tilling, harrowing, substrate leveling), planting activities (e.g., installation of nets), harvest (e.g., raking, dredge, hydraulic harvest), the grounding of vessels and support structures, and the general traffic of personnel and equipment. Sediment compaction can occur from vessel grounding, vehicle and personnel traffic. Topographic variation and natural debris such as large wood and boulders are often removed. In some cases this can result in filling of tidal channels in order to level a bed. Bed preparation techniques vary widely as do their effects depending on the specific cultured species and individual grower practices. Bed preparation and harvest activities such as dredging, tilling, raking, and hydraulic harvest result in turning over the sediments may temporarily alter the physical composition and chemistry of the sediment (Mercaldo-Allen and Goldberg
47
2011, Bendell-Young 2006, WDNR 2014b). Hydraulic harvest in geoduck culture areas results in liquefaction of the substrate.
Subtidal geoduck harvest temporarily leaves behind a series of depressions, or holes where the clams are extracted. The number of depressions created across a harvested area in a tract depends on the density of geoducks. The fate of these depressions, in terms of the time to refill, depends on the substrate composition and tidal currents. The time for them to refill can range from several days up to 7 months (Goodwin 1978).
Many activities result in a change to the composition of the native substrate which is often mud or sandflats. Graveling results in a generally firmer substrate with a larger grain size. Oyster bottom culture results in a substrate that is predominantly or entirely oysters that are periodically removed during harvest. Longline and stake culture result in an altered substrate that is partially shaded/occupied by oysters and stakes. Culture techniques that use racks, bags, nets, and PVC tubes result in an altered substrate that is intermittently or more broadly surfaced with plastic. There can be wide variability in the coverage of the plastic structure across the substrate depending on the practices of individual growers. Bag culture could be sufficiently dense to completely cover an existing substrate over a relatively broad area (Figure 2-9). Similarly plastic nets placed for clam or geoduck culture could extend over multiple acres (Figure 2-17). Alternatively, structures may be placed in rows that result in alternating plastic versus native substrate (Figure 2-10, Figure 2-18). Where the profile of the artificial structure is low, for example with bags resting on the substrate or area nets, sediment may gradually accumulate on top of the structure resulting in a return, at least in part, to a substrate similar to what existed before the activities were initiated. Periodic maintenance of the nets may remove this accumulated sediment. The artificial structure can be present for multiple years in a particular location (e.g., geoduck tubes) or can remain almost continuously over time as new crops are quickly planted after harvest (e.g., clam bags, area nets for clam culture).
Activities that involve placement of structure such as rafts, floating longlines, oyster longline, and rack and bag culture can affect water currents and circulation patterns, can lead to changes in rates of erosion and sedimentation, and altered tidal channels (WDNR 2014b, Wisehart 2007). An evaluation of aerial photographs indicates that tidal channels are generally less prevalent in aquaculture areas which may be due to gradual filling and/or grading that occurs as part of the work. Sedimentation and nutrient enrichment may occur from the settling of wastes to the substrate from the cultured species (Heffernan
1999, WDNR 2013a). Culture using rafts and longlines in particular often experience nutrient enrichment of the local sediments due to accumulation of biological waste and shell material from the cultured species. Anoxic sediments from nutrient enrichment have been documented below rafts (Hargrave et al. 2008; Heffernan 1999). Man-made debris such as metal and plastic can also accumulate beneath rafts.
3.1.3. Vegetation
Aquaculture activities classified as continuing active and fallow would occur in areas containing eelgrass. New project areas could disturb as much as ½ acre of submerged vegetation.
Effects on aquatic vegetation can occur where shellfish activities are co-located with aquatic vegetation including eelgrass and kelp. Rafts shade the underlying substrate limiting the growth of aquatic
48
vegetation. They are typically sited in waters too deep for eelgrass. Macroalgae such as kelp could be negatively affected or excluded from areas beneath rafts (WDNR 2014b). Floating culture using lines suspended from buoys would typically have a smaller footprint than a raft so substrate shading may be limited depending on spacing of the lines.
Ground-based culture activities are often conducted in the same tidal zone occupied by eelgrass. In Puget Sound, WDNR inventoried eelgrass (Z. marina) at a minimum elevation of -41 ft MLLW at a site in central Puget Sound and a maximum elevation of +7.5 ft MLLW at a site in Hood Canal (WDNR 2011). The average minimum and maximum elevations throughout Puget Sound were +0.3 to +3.0 ft MLLW. This range encompasses the elevations where ground-based shellfish activities would occur. When shellfish activities are co-located in areas with eelgrass, a net loss in eelgrass is typically the result either as a result of bed preparation activities, competition for space with the culture species or equipment, or harvest (Tallis et al. 2009, Wagner et al. 2012, Wisehart 2007; Dumbauld et al. 2009, Ruisink et al. 2012, NMFS 2009, NMFS 2005, Rumrill and Poulton 2004). This is the case for all forms of ground-based culture. Eelgrass is replaced by oysters, culture bags, and geoduck tubes. Eelgrass often coexists within the culture area albeit at a reduced density. Bed preparation and harvest activities physically remove eelgrass (Ruesink and Rowell 2012; Tallis et al. 2009; Boese 2002, Simenstad and Fresh 1995). Use of vessels and floats can smother and cause physical disturbance to eelgrass due to grounding of the vessels (NMFS 2005). Longline and suspended bag culture may shade eelgrass and preclude it underneath the structure (Skinner et al. 2014; WDNR 2014b). Biofouling on cover nets can reduce light availability for eelgrass (WDNR 2013a). The magnitude and duration of effect may vary depending on culture method and individual grower practices. For example, dense, mature bottom oyster culture may totally preclude eelgrass during certain parts of the aquaculture cycle while lesser densities of oyster may allow eelgrass to coexist within the culture area.
Eelgrass recovery times after disturbance vary depending on the type of disturbance, environmental conditions, and the availability of local seed sources. Timeframes can range from less than two to greater than five years (Dumbauld et al. 2009; Tallis et al. 2009; Wisehart; 2007, Boese 2002).
3.1.4. Benthic Community
Most shellfish activities affect the existing benthic community to some degree due to the physical disturbance of the substrate. Each phase of the aquaculture cycle of activity which is characterized by bed preparation (e.g., tilling), planting (e.g., net installation), maintenance (e.g., cleaning area nets), and harvest results in physical disturbance of the benthic community and often a temporary decrease in abundance of many infaunal and epifaunal species (Vanblaricom et al. 2015; Mercaldo-Allen and Goldberg 2011; WDNR 2014b; Straus et al. 2013; Dumbauld 2008; Heffernan 1999; Bendell-Young 2006; Simenstad and Fresh 1995). Bed preparation activities often directly remove many species including bivalve predator species, bivalve competitor species, and commercial species such as bivalves/burrowing shrimp. Bag culture techniques result in bags with bivalves placed directly on the substrate smothering the existing benthic community. The magnitude and duration of the effect is variable depending on the activity, individual husbandry practices, and environmental conditions. The benthic community typically recovers in a period of weeks or months depending on the activity (Vanblaricom et al. 2015; WDNR 2014b; Mercaldo-Allen and Goldberg 2011; WDNR 2008).
49
Benthic community diversity and/or composition may be altered as a result of physical changes to the substrate depending on the specific culture method and activity. Oyster bottom culture results in a shift in the composition of the benthic community to an oyster dominated community. This may have positive, negative or neutral effects on individual species. Areas with mature oyster bottom culture may have a comparable level of species diversity and abundance to an eelgrass based habitat (Ferraro and Cole 2007). Once oysters are harvested, the benthic community may begin transition back to the preoyster based community that existed previously. Regular graveling can result in shifts in the composition of the benthic community due to the change in substrate composition over time (Simenstad and Fresh 1995, Simenstad et al. 1991). When activities result in removal of eelgrass, a corresponding change in the benthic community occurs (Carvalho et al. 2006, Simenstad and Fresh 1995). Changes in sediment chemistry from nutrient enrichment can result in decreased benthic community abundance and diversity for some culture methods (Heffernan 1999; Stenton-Dozey 2001). Shifts in benthic community composition diversity are less clear for other culture methods and the subject of active study. Chemical changes to the benthic habitat can also occur as a result of aquaculture, particularly under floating rafts, where nutrients and aquaculture debris can accumulate.
Activities that include installation of artificial structure such as geoduck tubes, nets, bags, or longlines may result in shifts in benthic macrofauna. In a study of geoduck tubes, increased numbers of transient fish and macro invertebrate species were found when the structure was in place (McDonald et al. 2015). Effects ended when the structure was removed. Tubes and nets are typically in place for 2 to 3 years before harvest at 4 to 7 years. A study of rack and bag culture also suggested habitat benefits of the structure to certain fish and invertebrate species (Dealteris et al. 2004). Studies with area nets have been variable with no changes in species composition and diversity in some cases (Vanblaricom et al. 2015; Simenstad et al. 1993) and altered species diversity and composition measured in others (BendellYoung 2006).
3.1.5. Fish and Birds
In-water activity, noise, and increases in suspended sediment would displace many fish species and birds from localized work areas. Temporary decreases in benthic community abundance would locally decrease available prey for fish. Eelgrass provides important habitat and prey for many fish and bird species including juvenile salmon. In areas where eelgrass is removed, the fish community may be negatively affected (NMFS 2005).
Forage fish are an important prey resource for many species including Chinook salmon, steelhead, bull trout and marbled murrelet. Several forage fish including Pacific herring, surf smelt, and Pacific sand lance spawn throughout the action area. Spawning and egg incubation could potentially be affected by shellfish activities. In the Puget Sound region, herring spawn in the lower half of the intertidal or shallow subtidal zone down to a depth of -10 ft MLLW depending on water clarity (Penttila 2007). Native eelgrass, Z. marina, is of primary importance as a herring spawning substrate. Spawning also occurs on other aquatic vegetation and rocks. The removal of vegetation, which may occur as a result of some of the shellfish activities could decrease available spawning habitat for herring. Spawning has occurred on shellfish gear such as racks or tubes (Pentilla 2007). Work in areas with spawn may kill the eggs.
50
Sand lance deposit their eggs in substrate that is predominantly sand in the high intertidal above +5 ft
MLLW. Surf smelt tend to spawn in substrates with a mix of sand and gravel above +7 ft MLLW (Penttila 2007). Shellfish activities conducted when spawning is occurring or after eggs have been deposited could potentially disturb these species or destroy eggs. Culture and harvest activities would not typically occur above +7 ft MLLW but would occur below that elevation in the zone where sand lance may deposit eggs. Above +7 ft, shellfish activities would still occur including general travel to and from shellfish activity areas, temporary storage/staging of equipment, and grounding of floats which all could result in trampling, smothering, or loss of eggs.
Area nets used for clam and geoduck culture could potentially entrap fish, birds, or other aquatic species if they become loose or dislodged (Bendell 2015, Corps 2014b, Smith et al. 2006). This could occur due to variable husbandry practices with respect to net installation and maintenance, the high energy of the marine environment which makes securing nets difficult, and large wood debris strikes that create holes in the nets. Rack and/or bag culture could also entrap fish species by creating a physical barrier across the tidelands (Figure 2-10). This barrier could temporarily impound water and/or prevent fish from returning to deeper water during a receding tide which would result in stranding fish on the tidelands. The density and orientation of the structure relative to water drainage patterns would be particularly important in determining the risk of this occurring. Finally, nets associated with floating rafts would exclude fish from habitat under the rafts. Net deployment may occasionally capture fish depending on the depth of the nets.
3.1.6. Contaminants
The use of vessels and vehicles could result in accidental discharges of fuel, lubricants, and hydraulic fluids. The effect on water quality depends on the type of contaminant spilled, time of year, spill volume, and success of containment efforts.
Plastic debris such as nets and tubes may break free from project sites and be released to the environment. These materials eventually breakdown in the environment into small plastic particles called microplastics which can be ingested by organisms and accumulate up the food web (Wright et al 2013). Microplastics have been found in numerous species including fish and shellfish species and documented to have adverse effects (Lönnstedt and Eklöv 2016). Microplastics have been found in Puget Sound (Davis and Murphy 2015). It is uncertain to what degree aquaculture contributes to this debris.
3.1.7. Noise
Noise from equipment operation could temporarily disturb and displace both aquatic and upland species from the local area. The types of vessels commonly used for shellfish activities are listed in Table 2-1. To estimate noise produced by shellfish activities, an analysis was conducted using data from Wyatt (2008) for a commonly used vessel, a 21-foot Boston Whaler with a 250 horsepower Johnson 2-cycle outboard motor. Operating this vessel at full speed produced a sound measured at 147.2 decibels (dB) root mean square (RMS) re 1 microPascal at 1 meter[1]. Assuming a background underwater sound level
51
of 120 dB RMS, which is the threshold established by NMFS for behavioral effects to marine mammals, and using the practical spreading loss model preferred by NMFS and USFWS, sound produced by this vessel would attenuate to 120 dB RMS within 65 meters (213 feet). Larger vessels could also be used on occasion which could potentially generate greater underwater sound levels.
The intermittent use of power equipment is likely to produce in air noise of up to 81 dBA for dive harvesting and 82 dBA for shoreline work. Over marine water, the 81 dBA value would attenuate to the background level (57 dBA) within 792 feet and over a terrestrial habitat the 82 dBA would attenuate to the background noise level of a rural environment (35 dBA) within 3793 feet (0.71 mile). Maximum surface noise levels from boat operations and dive support equipment for subtidal geoduck harvest was measured at 61 to 58 dBA at a distance of 100 feet where auxiliary equipment was housed on deck and 55 to 53 dBA where equipment was housed below deck (WDNR 2008).
3.1.8. Summary
Effects of the various shellfish activities on habitat are summarized in Table 3-1. It is a summary of worst-case effects that would not necessarily occur in all locations where the activity is occurring.
Substantial local variability would be expected due to individual grower practices (e.g., densities, scale, techniques) and environmental conditions.
Table 3-1. Summary of shellfish activity effects on habitat
|
Shellfish Activity |
Cultured/ Harvested Species |
Primary Effects on Habitat |
|
floating culture |
and harvest |
methods |
|
floating culture with rafts, antipredator nets |
mussel |
|
|
surface longlines |
mussel, oyster, clam |
• limited shading of substrate, minor effects on aquatic vegetation |
|
FLUPSYs |
oyster, clam, geoduck |
• shades substrate preventing or limiting growth of aquatic vegetation |
|
ground-based c |
ulture and har |
vest methods |
|
oyster bottom culture |
oyster |
• altered benthic habitat and species composition • aquatic vegetation replaced by oyster habitat |
|
longline, stake culture |
oyster |
|
52
|
Shellfish Activity |
Cultured/ Harvested Species |
Primary Effects on Habitat |
|
rack and bag culture |
oyster |
|
|
clam ground culture |
clam |
|
|
bag culture (bags directly on substrate) |
clam, oyster |
|
|
geoduck culture |
geoduck |
|
|
low tide activiti install and maintenance of area nets |
es clam, geoduck |
|
|
‘hand’ harvest (rakes, shovels, containers) |
clam, oyster |
|
|
bed preparation (mechanized tilling, leveling substrate, hydraulic preharvest) |
oyster, clam, geoduck |
|
|
low tide hydraulic harvest |
geoduck |
|
|
longline harvest |
oyster |
|
|
vehicle and vessel traffic on tidelands |
oyster, clam, geoduck, mussel |
|
|
temporary equipment storage on tidelands; use |
oyster, clam, geoduck, mussel |
|
53
|
Shellfish Activity |
Cultured/ Harvested Species |
Primary Effects on Habitat |
|
of floats, work platforms |
||
|
in-water activiti |
es |
|
|
dredging, harrowing, longline harvest |
oyster, clam |
|
|
graveling |
oyster, clam |
|
|
hydraulic dive harvest |
geoduck |
|
3.2. Spatial Extent and Frequency of Effects
The following section discusses the scale and frequency of activities and effects resulting from the proposed action.
3.2.1. Extent of Floating Activities
Floating aquaculture occurs in all of the geographic regions except for Grays Harbor. In all cases the acreages involved are negligible in the context of each region. Activities are concentrated in a few embayments (e.g., Quilcene Bay, Penn Cove) where the acreage covers a larger percent of the embayment area (see figures in Appendix D). Effects would be limited to the immediate proximity of the work areas and would continue for the duration of the permit authorization and likely beyond.
3.2.2. Extent of Tideland Activities
The vast majority of the ground-based continuing active and fallow/new activities would occur in the intertidal zone as would all of the new aquaculture, restoration, and recreation activities. An unknown but likely insignificant percentage of the ground-based continuing aquaculture activities (both active and fallow) would occur in the shallow subtidal zone. For these reasons and to simplify the analysis, the entire ground-based acreage is considered intertidal. The percentage of the total intertidal acreage that would be devoted to shellfish activities within each geographic region is summarized in Table 3-2. The total tideland acres are based on the area classified as marine tideland in the Washington State aquatic parcel GIS database (WDNR 2014a). Marine tidelands extend from ordinary high tide down to extreme
54
low tide (WDNR 2013a). This analysis indicates proportionally how much of the intertidal habitat would be affected by the proposed action.
Table 3-2. Project area acreage relative to total tideland acreage
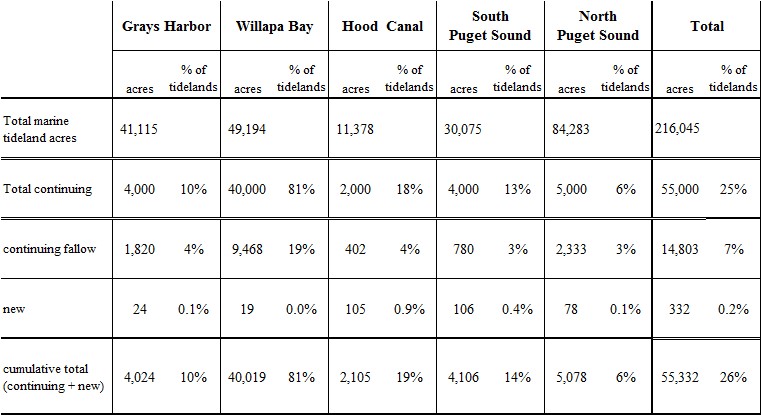
For all regions combined, the continuing fallow and new shellfish activity would occur on 8% of the combined tidelands. This varies between a low of 3% in South Puget Sound to a high of 19% in Willapa Bay. Continuing active aquaculture activities occur on 10% of the combined tidelands across all the regions although there is quite a bit of variability ranging from a low of 2% in North Puget Sound to a high of 33% in Willapa Bay. The cumulative total percentage of tidelands with some form of shellfish activity is 18% across all the regions. This coarse scale analysis illustrates the geographic magnitude of the action. Comparatively higher percentages of tidelands may be affected in individual embayments within each region. For example, in South Puget Sound, shellfish activities are concentrated in the far south and west corner of the region (see Appendix D). In north Puget Sound, shellfish activities are concentrated in several smaller embayments including Samish Bay, Discovery Bay, and Kilisut Harbor.
The acreages classified as fallow and new contain relatively undisturbed habitat currently. The action would result in a change from this undisturbed habitat to an aquaculture farm. Activities with effects similar to those described in Section 3.1 would occur on this acreage over the period of the permit authorization.
3.2.3. Frequency of Disturbance
Some of the proposed shellfish activities may only be conducted once in that footprint over the anticipated 5 year period of the permit authorization and thus would have a very limited period of effects. In other cases, multiple activities may occur on a given footprint annually or potentially more
55
frequently. For example active maintenance of cover nets for clams could occur monthly. Active oyster bottom culture on a given footprint could include two successive dredges, harrowing, and graveling each year. The frequency of activities on most acreage would fall somewhere in between these extremes. The variability in activity frequency among shellfish growers is also high. Table 3-3 lists frequencies of occurrence for a number of the activities. The information was gathered from individuals engaged in aquaculture in the State of Washington (Corps 2014a, Corps 2011).
Table 3-3. Shellfish activity frequency of occurrence and acres completed per day

Note: This information does not necessarily encompass the full range of activity rates and frequencies for the activities. There is wide variability. The information is considered representative but is based on a limited sampling of aquaculture growers (sources Corps 2014a, Corps 2011).
For some areas, particularly larger aquaculture acreages, there is a progression of activity from one end of the acreage to the other that may occur over a series of days, weeks, or longer. Certain effects, such as increases in suspended sediment, from one part of the acreage may drift over locations where the activity had previously been completed thereby extending the duration of effects in that location. This is most applicable to those activities that take comparatively longer to conduct (see Table 3-3). For example, harvest of cultured geoduck is a comparatively time consuming activity that could occur for months at a particular location as it slowly progresses across the acreage.
Most of the activities occur at a frequency of only once every year, or once every few years on given acreage. In the context of the temporary impacts that occur with the activities, the relevance of this frequency is dependent on recovery from the impact. Effects that diminish quickly such as increases in suspended sediment are minor in the context of a once per year frequency. The collective activities conducted on a particular acreage may increase this to 3 or 4 times per year. Collectively the total period of effects is still minor and on the order of days. For impacts that require a slightly longer period for recovery such as the benthic community (weeks to months) following bed preparation or harvest activities, the period for effects would be comparatively longer. For impacts where recovery times are on the order of years, such as disturbance to eelgrass, an annual or every few year repeat disturbance
56
may never allow a full recovery of the eelgrass from the impact or the impact would be repeated shortly after recovery is achieved.
In-water Disturbance
Activities conducted in-water include graveling, harrowing, dredging, mechanical longline harvest, and geoduck dive harvest where there is potential to directly affect fish species. To determine the frequency and extent of these in-water activities at a regional scale, estimates were made for the total acres per day worked and total activity days for each region. ‘Acres worked per day’ is an estimate of the number of acres that would be worked every day for one year to complete the tasks in one year. The analysis assumes the activity effort is equally spread across the entire year which may be unrealistic but does provide some indication of the relative scale of the collective activity level. ‘Activity days per year’ is an estimate of the number of days that are required to be worked in order to complete the task on the activity acres during one year. It is analogous to ‘man-days’. More detail including the methodology used to develop the estimates can be found in Appendix C. The locations of the specific in-water activities can be found in Appendix F. This analysis is for work that occurs in the intertidal zone, so it does not include subtidal geoduck dive harvest.
The analysis suggests work is regularly occurring, perhaps on a daily basis, at the regional scale. This is consistent with the idea that shellfish product must be delivered to market on a regular and perhaps daily basis. Willapa Bay is by far the region with the most work occurring. There are an estimated 139 acres that would be worked each work day to accomplish all the tasks in one year. Relative to the total tideland acreage per region, the acres worked per day estimate is negligible (0.3 % in Willapa Bay). If assume work only occurs once per month, this increases to 6% of the tidelands worked in Willapa Bay on that one day per month. In some small embayments where shellfish activities are more concentrated, this percentage of activity relative to the total tidelands in that one embayment would be higher.


Note: acres worked/day assumes work occurs each work day throughout the year (260 work days/yr)
3.2.4. Cover Nets and Artificial Structure
Culture methods that result in a change to the substrate (e.g., bag culture, cover nets) would result in impacts that may be more or less continuous for the period of the permit authorization because there is no recovery or return to the prior substrate and habitat conditions. A new crop of bags would be placed shortly after the previous crop is harvested. Geoduck culture would result in periods with and without structure. Depending on individual grower practices, structure to support geoduck culture is expected to occur between 30 and 100% of the time.
The placement of artificial structure for growing shellfish occurs in all the geographic regions. The number of acres potentially with artificial structure is summarized by region in Table 3-5. These acreages are best interpreted as a maximum for each culture method which, if implemented, would result in a less than equivalent decrease in acreage for another activity in the region (see discussion in Appendix B). The geographic locations where cover nets would occur for the continuing active and fallow acres are illustrated in Appendix G. It is assumed that all new aquaculture activities will also employ methods using artificial structure. Restoration and recreation related activities are generally not expected to employ artificial structure although there may some exceptions. Table 3-5. Artificial structure by region
|
|
Grays Harbor |
Willapa Bay |
Hood Canal |
South Puget Sound |
North Puget |
|
|
oyster longline/stake |
active |
732 |
4,377 |
268 |
171 |
719 |
|
fallow |
533 |
1,913 |
77 |
51 |
2,081 |
|
|
rack and/or bags (clam and oyster) |
active |
29 |
829 |
115 |
189 |
328 |
|
fallow |
6 |
72 |
23 |
51 |
2,050 |
|
|
geoduck tubes |
active |
0 |
1 |
453 |
931 |
369 |
|
fallow |
0 |
67 |
110 |
518 |
2,108 |
|
|
cover nets |
active |
0 |
3,380 |
538 |
2,011 |
637 |
|
fallow |
0 |
2,637 |
337 |
724 |
2,204 |
|
|
new aquaculture |
100 |
100 |
438 |
448 |
315 |
|
|
total |
active |
861 |
8,687 |
1,812 |
3,750 |
2,368 |
58
fallow & new
639
4
,789
985
1
,792
,758
8
total (plastic
structure only)
active
129
,310
4
1
,544
3
,579
1
,649
fallow & new
106
2
,876
908
,741
1
,677
6
Notes:
- Acreages are likely overstated by some unknown amount due to double or triple counting associated with limited detail on permit applications (See App. B). Acreages are best interpreted as a maximum for each activity which, if implemented, would result in a less than equivalent decrease in acreage for another activity in the region.
- All new acres assumed to potentially contain plastic structure or longline/stake.
3.2.5. Eelgrass
The continuing active and fallow aquaculture acres could potentially occur in areas with eelgrass. A geographic analysis was conducted to estimate the aquaculture acreage potentially co-located with eelgrass. A description of the analysis, detailed results, and figures illustrating geographic locations where aquaculture and eelgrass are co-located can be found in Appendix D. The results provide a conservative estimate of aquaculture co-located with eelgrass appropriate for this analysis. The results are summarized in Table 3-6. They suggest there is substantial overlap between eelgrass and much of the continuing active and fallow aquaculture acreage. This pattern occurs in all the geographic regions. An estimated 14,803 acres of continuing active aquaculture is potentially co-located with eelgrass across all the geographic regions. This results in reduced productivity and habitat function for this eelgrass as discussed in Section 7.1. This is an ongoing effect under the environmental baseline that will continue under the proposed action. An estimated 11,227 acres of continuing fallow acreage would be colocated with eelgrass under the proposed action. Effects to eelgrass in the fallow areas would be considered new effects relative to the environmental baseline. The magnitude of effect would be dependent on the type of culture method employed and the activities conducted as described in Section
7.1.
Willapa Bay has by far the most overlap between eelgrass and the continuing active and fallow acres. This is followed by the North Puget Sound and Grays Harbor regions where over 1,000 acres of eelgrass are estimated to overlap with the fallow acreage. Aquaculture activities (active and fallow) are more often than not co-located with eelgrass in Willapa Bay, Grays Harbor, and the North Puget Sound Region. In the Hood Canal region, aquaculture acreage is equally split between areas with and without eelgrass. The South Puget Sound region appears to be the notable exception where a minority of the acreage is co-located with eelgrass. Continuing aquaculture activities would occur in 49% of the total mapped eelgrass acreage in Willapa Bay and 21% of the mapped eelgrass in Hood Canal. These percentages are less in the other regions.
Table 3-6. Summary of shellfish activities potentially co-located with eelgrass
|
|
Grays Harbor |
Willapa Bay |
Hood Canal |
South Puget Sound |
North Puget Sound |
Total |
|
# continuing active footprints |
17 |
161 |
34 |
2 |
21 |
235 |
|
continuing active acres |
766 |
12,170 |
392 |
180 |
1,131 |
14,803 |
59
|
# continuing fallow footprints |
13 |
81 |
42 |
1 |
13 |
150 |
|
continuing fallow acres |
1,152 |
7,448 |
294 |
95 |
2,239 |
11,227 |
|
Total acres (active & fallow): |
1,918 |
19,618 |
685 |
275 |
3,370 |
25,866 |
|
% of continuing active acreage potentially colocated with eelgrass |
67% |
74% |
41% |
8% |
84% |
66% |
|
% of continuing fallow acreage potentially colocated with eelgrass |
63% |
79% |
73% |
12% |
96% |
76% |
|
% of eelgrass in region potentially co-located with aquaculture (active & fallow) |
5% |
49% |
21% |
9% |
7% |
20% |
Note: See Appendix D for more detail, summary of methodology, and geographic locations
3.2.6. Forage Fish
The continuing active and fallow acreages could be co-located with forage fish spawning areas and thus affect spawning success as discussed previously in Section 7.1. A geographic analysis was conducted to estimate the aquaculture acreage potentially co-located with forage fish spawning areas. A description of the analysis, detailed results, and figures illustrating geographic locations where aquaculture and forage fish spawning are co-located can be found in Appendix E. The analysis is summarized in Table 3-7 and suggests there is substantial overlap between forage fish spawning locations and aquaculture activities. There are an estimated total of 3,297 fallow acres across all regions co-located with forage fish spawning areas. In the two Puget Sound regions and in Hood Canal, active and fallow acreage is colocated with mapped spawning habitat for all three forage fish species analyzed. In Grays Harbor and Willapa Bay, aquaculture acreage appears co-located only with herring spawning areas.
Table 3-7. Summary of continuing active and fallow acreage potentially co-located with WDFW mapped forage fish spawning areas
|
|
Grays Harbor |
Willapa Bay |
Hood Canal |
South Puget Sound |
North Puget Sound |
Total |
|
Herring continuing active acres |
73 |
2,200 |
211 |
79 |
486 |
3,049 |
|
continuing fallow acres |
0 |
510 |
58 |
14 |
2,184 |
2,766 |
|
Surf smelt continuing active acres |
0 |
0 |
130 |
532 |
59 |
721 |
|
continuing fallow acres |
0 |
0 |
67 |
359 |
15 |
441 |
|
Sand lance continuing active acres |
0 |
0 |
169 |
78 |
79 |
326 |
|
continuing fallow acres |
0 |
0 |
28 |
20 |
42 |
90 |
|
total active acres co-located with spawning areas |
73 |
2,200 |
510 |
688 |
623 |
4,094 |
60
|
% of total active acres colocated with spawning areas |
6% |
13% |
54% |
29% |
46% |
18% |
|
total fallow acres co-located with spawning areas |
0 |
510 |
153 |
394 |
2,241 |
3,297 |
|
% of total fallow acres colocated with spawning areas |
0% |
5% |
37% |
50% |
96% |
22% |
|
cumulative total (active + fallow): |
73 |
2,710 |
663 |
1082 |
2,864 |
7,391 |
|
% of cumulative total colocated with spawning areas |
2% |
10% |
49% |
34% |
78% |
20% |
Note: See Appendix E for more detail, summary of methodology, and maps.
The analysis suggests that Willapa Bay and North Puget Sound are the regions where the most overlap may occur on an acreage basis. Relative to the total mapped herring spawning area in each region, activities in Willapa Bay tend to occur in well over half of the mapped spawning area, by far the largest proportion of any of the regions. Most of this overlap is with ongoing aquaculture activities. The North Puget Sound region contains the most fallow acres (2,241 acres) potentially co-located with forage fish spawning areas. Much of this is overlap with the herring spawning area in Samish Bay. The South Puget Sound region active and fallow acres are co-located more with surf smelt spawning areas relative to the other two species.
Table 3-8. Percent of total mapped herring spawning area potentially affected by continuing activities in active and fallow areas
|
|
Grays Harbor |
Willapa Bay |
Hood Canal |
South Puget Sound |
North Puget |
|
Total WDFW mapped herring spawning acres |
462 |
4,691 |
5,179 |
4,740 |
Sound 33,730 |
|
% of total mapped herring acres that potentially overlap with continuing active acres |
16% |
47% |
4% |
2% |
1% |
|
% of total mapped herring acres that potentially overlap with continuing fallow acres |
0% |
11% |
1% |
0.3% |
6% |
3.3. Summary of Primary Effects by Region
This section summarizes the future expected activities and habitat effects for each of the geographic regions.
3.3.1. Grays Harbor
Oyster bottom culture and its related activities predominate in Grays Harbor with longline culture also common. In-water activities common to the region include dredging, harrowing, and longline harvest.
61
This is expected to continue in the future. Fallow and new acreage is also anticipated to be predominantly for oyster culture using the same methods. The mechanical clam harvester and cover nets are being introduced to Grays Harbor on 363 acres of existing project area. It is assumed that all anticipated new activities could contain cover nets or bags for clam culture.
A total of 5% of the total tidelands in the region would be altered from the current relatively undisturbed condition to an aquaculture farm with corresponding effects on the habitat and species. Effects from activities conducted on this acreage would persist for the duration of the permit authorization and likely longer assuming the farm remains in business. Cumulatively, effects from all shellfish activities including on acreage classified as continuing active would occur on 7.5% of the tidelands in Grays Harbor. Effects would be concentrated in the North and South lobes of the embayment on the extensive tidelands in these areas (see Figure D-1).
There are an estimated 1,152 fallow acres co-located with eelgrass in Grays Harbor. The action assumes oyster bottom and longline culture methods would occur in these areas in the future. This would substantially reduce or eliminate the eelgrass in these areas at least during significant portions of the culture and harvest cycle. It does not appear that any fallow acreage is co-located with forage fish spawning areas so no impact to these species is anticipated.
Temporary habitat effects of the activities include short-term degradation of water quality, noise and general activity disturbance, and temporary decreases in benthic community abundance. These activities would be expected to displace fish and other species in the immediate vicinity of the activity. The frequency of in-water work is conservatively estimated to be 10 acres worked per day averaged over one year for activities on fallow and new acres and 15 acres per day for all shellfish activities, which is 0.04% of the total tideland area in the Grays Harbor region.
3.3.2. Willapa Bay
Oyster bottom culture is the primary culture method in Willapa Bay with a lesser amount of longline culture, limited oyster rack and bag culture and some clam culture. There does appear to be substantial acreage with cover nets. In-water activities common to the region include dredging, harrowing, graveling, and longline harvest. This relative distribution of culture methods and individual activities is expected to continue in the future on both continuing active and fallow acres. New activities are expected to be focused on geoduck culture with lesser amounts of clam, oyster, and mussel culture. No restoration, recreation, or subtidal geoduck activities are expected to occur in Grays Harbor.
A total of 19% of the total tidelands in the region would be altered from the current relatively undisturbed condition to an aquaculture farm with corresponding effects on the habitat and species. Effects from activities conducted on this acreage would persist for as long as the permit authorization or the work occurs/farm remains in business. Cumulatively, effects from all shellfish activities including on acreage classified as continuing active would occur on 53% of the tidelands in Willapa Bay. Effects would occur throughout the region on the extensive tidelands that characterize the embayment.
There are an estimated 7,448 fallow acres co-located with eelgrass in Willapa Bay. The action assumes oyster bottom and the other activities listed above would occur in these areas in the future. This would substantially reduce or eliminate the eelgrass in these areas at least during significant portions of the culture and harvest cycle. There are an estimated 510 fallow acres co-located with herring spawning
62
areas. Spawning in these areas would be negatively affected primarily by the loss of eelgrass spawning substrate.
Temporary habitat effects of the activities include short-term degradation of water quality, noise and general activity disturbance, and temporary decreases in benthic community abundance. These activities would be expected to displace fish and other species in the immediate vicinity of the activity. The frequency of in-water work is conservatively estimated to be 53 acres worked per day averaged over one year for activities on fallow and new acres and 139 acres per day for all shellfish activities, which is 0.3% of the total tideland area in the Willapa Bay region.
3.3.3. Hood Canal
Oyster and clam culture are both common in Hood Canal with a smaller amount of geoduck. Bottom culture is the primary method for growing all species. There are lesser amounts of longline and rack and/or bag culture. An estimated 538 active and 337 fallow acres are estimated to use cover nets which is about 10% of the total acreage in Hood Canal. In-water activities that occur include graveling, dive harvest, and longline harvest. This relative distribution of culture methods and individual activities is expected to continue in the future on both continuing active, fallow, and new aquaculture acres.
A total of 8% of the total tidelands in the region would be altered from the current relatively undisturbed condition to an aquaculture farm with corresponding effects on the habitat and species. Effects from activities conducted on this acreage would persist for as long as the permit authorization or the work occurs/farm remains in business. Cumulatively, effects from all shellfish activities including on acreage classified as continuing active would occur on 16% of the tidelands. Hood Canal is a deep fiord like embayment characterized by narrow ribbons of tidelands along the shoreline interrupted by small estuaries at river mouths that have a somewhat greater tideland area depending on the size of the river. Activities and their effects would be focused along these shoreline areas and estuaries throughout the region.
There are an estimated 257 fallow acres co-located with eelgrass in Hood Canal. The action assumes oyster and clam bottom and the other activities listed above would occur in these areas in the future. This would substantially reduce or eliminate the eelgrass in these areas at least during significant portions of the culture and harvest cycle. There are an estimated 153 fallow acres co-located with forage fish spawning areas. Spawning in these areas would be negatively affected primarily by the loss of aquatic vegetation spawning substrate and smothering of eggs.
Temporary habitat effects of the activities include short-term degradation of water quality, noise and general activity disturbance, and temporary decreases in benthic community abundance. These activities would be expected to displace fish and other species in the immediate vicinity of the activity. The frequency of in-water work is conservatively estimated to be 5 acres worked per day averaged over one year for activities on fallow and new acres and 7 acres per day for all shellfish activities, which is 0.05% of the total tideland area in the Hood Canal region.
3.3.4. South Puget Sound
Oyster and clam culture are both common in South Puget Sound followed closely by geoduck. Bottom culture is the primary method for growing all species with some longline and rack and/or bag culture.
63
Cover nets are common and occur on about 75% of the continuing footprints. An estimated 2,011 active and 724 fallow acres are estimated to use cover nets. In-water activities that occur include dredging, graveling, dive harvest, and longline harvest. This relative distribution of culture methods and individual activities is expected to continue in the future on both continuing active, fallow, and new aquaculture acres.
A total of 5% of the total tidelands in the region would be altered from the current relatively undisturbed condition to an aquaculture farm with corresponding effects on the habitat and species. Effects from activities conducted on this acreage would persist for as long as the permit authorization or the work occurs/farm remains in business. Cumulatively, effects from all shellfish activities including on acreage classified as continuing active would occur on 12% of the tidelands. Activities and effects in the South Puget Sound region would be focused in the south and east part of the region along shoreline areas and in small embayments although new activities could occur throughout the region. Most of the acreage in some of these smaller estuaries may be engaged aquaculture.
There are an estimated 115 fallow acres co-located with eelgrass in South Puget Sound. The action assumes the shellfish activities listed above would occur in these areas in the future. This would substantially reduce or eliminate the eelgrass in these areas at least during significant portions of the culture and harvest cycle. There are an estimated 394 fallow acres co-located with forage fish spawning areas, primarily for surf smelt. Spawning in these areas would be negatively affected primarily by the smothering of eggs.
Temporary habitat effects of the activities include short-term degradation of water quality, noise and general activity disturbance, and temporary decreases in benthic community abundance. These activities would be expected to displace fish and other species in the immediate vicinity of the activity. The frequency of in-water work is conservatively estimated to be 6 acres worked per day averaged over one year for activities on fallow and new acres and 14 acres per day for all shellfish activities, which is 0.05% of the total tideland area in the South Puget Sound region. Given the concentration of activity acreage in the south and east corner of the region, the frequency of activity in this area would be quite a bit higher than this average.
3.3.5. North Puget Sound
Oyster and clam culture are both common in North Puget Sound with a very small amount of geoduck. Bottom culture is the primary method for growing all species with some longline, stake, and rack and bag culture. Cover nets are common and occur on about 46% of the continuing footprints. An estimated 637 active and 2,204 fallow acres are estimated to use cover nets. In-water activities that occur include graveling, harrowing, dive harvest, and longline harvest. This relative distribution of culture methods and individual activities is expected to continue in the future on both continuing active, fallow, and new aquaculture acres.
A total of 3% of the total tidelands in the region would be altered from the current relatively undisturbed condition to an aquaculture farm with corresponding effects on the habitat and species. Effects from activities conducted on this acreage would persist for as long as the permit authorization or the work occurs/farm remains in business. Cumulatively, effects from all shellfish activities including on acreage classified as continuing active would occur on 5% of the tidelands. Activities and effects in the
64
North Puget Sound region would be focused in a handful of embayments including Samish Bay, Discovery Bay, Sequim Bay, Kilisut Harbor and in the vicinity of Skagit Bay. The percent of tidelands engaged in shellfish activities in these embayments would be significantly higher than this regional average. For example, 50% of the tidelands in Samish Bay contain continuing active or fallow acreage. New activities could occur throughout the region.
There are an estimated 2,194 fallow acres co-located with eelgrass in North Puget Sound. The action assumes the shellfish activities listed above would occur in these areas in the future. This would substantially reduce or eliminate the eelgrass in these areas at least during significant portions of the culture and harvest cycle. There are an estimated 2,241 fallow acres co-located with forage fish spawning areas, primarily for herring. Spawning in these areas would be negatively affected by the loss of eelgrass spawning substrate.
Temporary habitat effects of the activities include short-term degradation of water quality, noise and general activity disturbance, and temporary decreases in benthic community abundance. These activities would be expected to displace fish and other species in the immediate vicinity of the activity. The frequency of in-water work is conservatively estimated to be 11 acres worked per day averaged over one year for activities on fallow and new acres and 18 acres per day for all shellfish activities, which is 0.02% of the total tideland area in the region. The frequency of activity in the embayments where activities are concentrated would be significantly higher than this regional average.
65
4. Cumulative Impacts
This analysis assesses cumulative impacts of the proposed action as defined under the National Environmental Policy Act (NEPA) and the CWA Section 404(b)(1) regulations. Under NEPA, a cumulative impact as defined as follows:
Cumulative impact is the impact on the environment which results from the incremental impact of the action when added to other past, present, and reasonably foreseeable future actions regardless of what agency (Federal or non-Federal) or person undertakes such other actions. Cumulative impacts can result from individually minor but collectively significant actions taking place over a period of time (40 CFR 1508.7).
A determination of significance under NEPA requires considerations of both context and intensity. Context “means that the significance of an action must be analyzed in several contexts such as society as a whole (human, national), the affected region, the affected interests, and the locality. Significance varies with the setting of the proposed action. For instance, in the case of a site-specific action, significance would usually depend upon the effects in the locale rather than in the world as a whole. Both short- and long-term effects are relevant (40 CFR 1508.27(a)). Intensity “refers to the severity of impact” (40 CFR 1508.27(b)). According to the CFR, the following should be considered when evaluating intensity:
- Impacts that may be both beneficial and adverse. A significant effect may exist even if the Federal agency believes that on balance the effect will be beneficial.
- The degree to which the proposed action affects public health or safety.
- Unique characteristics of the geographic area such as proximity to historic or cultural resources, park lands, prime farmlands, wetlands, wild and scenic rivers, or ecologically critical areas.
- The degree to which the effects on the quality of the human environment are likely to be highly controversial.
- The degree to which the possible effects on the human environment are highly uncertain or involve unique or unknown risks.
- The degree to which the action may establish a precedent for future actions with significant effects or represents a decision in principle about a future consideration.
- Whether the action is related to other actions with individually insignificant but cumulatively significant impacts. Significance exists if it is reasonable to anticipate a cumulatively significant impact on the environment. Significance cannot be avoided by terming an action temporary or by breaking it down into small component parts.
- The degree to which the action may adversely affect districts, sites, highways, structures, or objects listed in or eligible for listing in the National Register of Historic Places or may cause loss or destruction of significant scientific, cultural, or historical resources.
66
- The degree to which the action may adversely affect an endangered or threatened species or its habitat that has been determined to be critical under the Endangered Species Act of 1973.
- Whether the action threatens a violation of Federal, State, or local law or requirements imposed for the protection of the environment.
The CEQ guidance document “Considering Cumulative Effects under the National Environmental Policy Act” (1997) and the 2005 memo from CEQ (CEQ 2005) provides guidance on how to structure cumulative effects analysis. The steps are summarized in Table 4-1.
Table 4-1. Steps in cumulative effects analysis to be addressed in each component of environmental impact assessment (from CEQ 1997).
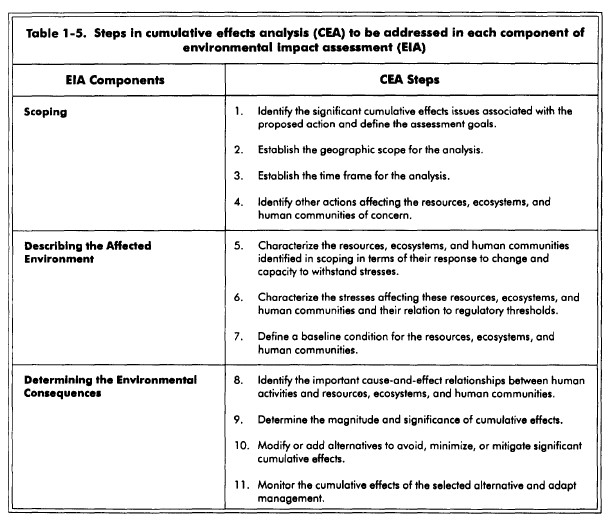
Under CWA Section 404(b)(1) cumulative impacts are defined as follows:
Determination of cumulative effects on the aquatic ecosystem (40 CFR 230.11(g)).
- Cumulative impacts are the changes in an aquatic ecosystem that are attributable to the collective effect of a number of individual discharges of dredged or fill material. Although the
67
impact of a particular discharge may constitute a minor change in itself, the cumulative effect of numerous such piecemeal changes can result in a major impairment of the water resources and interfere with the productivity and water quality of existing aquatic ecosystems.
- Cumulative effects attributable to the discharge of dredged or fill material in waters of the United States should be predicted to the extent reasonable and practical. The permitting authority shall collect information and solicit information from other sources about the cumulative impacts on the aquatic ecosystem. This information shall be documented and considered during the decision-making process concerning the evaluation of individual permit applications, the issuance of a General permit, and monitoring and enforcement of existing permits.
The 404(b)(1) guidelines further state:
To predict cumulative effects, the evaluation shall include the number of individual discharge activities likely to be regulated under a General permit until its expiration, including repetitions of individual discharge activities at a single location (40 CFR 230.7b3).
The 404(b)(1) guidelines outlined in 40 CFR 230 guide how the analysis is conducted. This analysis only evaluates the proposal against 230.10 (c), determination of significant degradation, which is only one of the compliance requirements. Evaluation of the proposal against Subparts C thru F for cumulative effects are discussed below.
4.1. Scope of Analysis
CEQ guidance recommends that cumulative effects analysis focus on effects to the resources affected by the proposed action as opposed to the traditional focus on effects based on the perspective of the action (CEQ 2005, CEQ 1997). A focus on the resource helps ensure all effects to the resource itself are discussed in the context of the action. This approach has been adopted for the 2017 NWP 48 cumulative effects analysis. An important component of the analysis is identifying other unrelated actions, past, present, and reasonably foreseeable in the future, that have or could potentially affect the resources affected by the proposed action.
The 404(b)(1) guidelines require cumulative effects analysis evaluate effects of all potential activity conducted under the General permit (e.g., each permit verification). Effects to resources from other activities or a reissuance of the permit are beyond the scope. The CEQ guidelines for the NEPA analysis thus are broader in identifying and evaluating effects to resources. The analysis below is thus focused on this broader evaluation under NEPA. Cumulative effects under CWA would fall within the effects envelope described for NEPA.
4.1.1. Resources Affected
For practical purposes, the geographic footprint of the proposed action is Willapa Bay, Grays Harbor, and the greater Puget Sound or Salish Sea. This is where all of the historical NWP 48 authorized work has occurred in the past and where it is expected to occur for the 2017 version of the NWP 48. Effects
68
to resources could thus occur in these regions. Due to the broad geographic area encompassed by the proposed action, the resources affected vary depending on the region.
In addition to being potentially affected by the proposed action, the following screening criteria were used to identify important affected resources for the analysis:
- listed under the ESA, MSA or designated critical habitat in area;
- provides a key ecological role (e.g., important component of the food web);
- important to commercial or recreational fisheries;
- is the focus of significant regional or national restoration or planning initiatives;
- managed with some degree of regional or national protected status;
Resources that meet the above criteria have been categorized according to the three primary geographic areas in Table 4-2.
Table 4-2. Important resources affected by the proposed action
|
Grays Harbor |
Willapa Bay |
Puget Sound |
|
Eelgrass (Z. marina) |
Eelgrass (Z. marina) |
Eelgrass (Z. marina) |
|
Benthic invertebrate community |
Benthic invertebrate community |
Benthic invertebrate community |
|
Salmon species (Chinook, coho, chum) |
Salmon species (Chinook, coho, chum) |
Salmon species (Chinook, coho, chum) |
|
Pacific herring |
Pacific herring |
Pacific herring, sand lance, surf smelt |
|
Dungeness crab |
Dungeness crab |
Dungeness crab |
|
Green sturgeon |
Green sturgeon |
Canary rockfish, bocaccio |
|
Pacific groundfishes (E. sole) |
Ground fish (E. sole) |
|
|
Bull trout |
|
Bull trout |
|
Snowy plover |
Snowy plover |
|
Consistent with CEQ guidance the cumulative effects analysis is not an exhaustive analysis on all species and resources affected. Rather the analysis is focused on those resources that are measurably affected by the action in an important way and that could be further impacted by other actions past, present, or reasonably foreseeable so that a more comprehensive review can be conducted on a smaller number of resources.
The effects analysis is focused on eelgrass, sand lance/surf smelt and the benthic community. The other species listed in Table 4-2 are not discussed.
The effects on some species, such as Dungeness crab and eelgrass, are directly related to effects on eelgrass. Other species such as salmon, rockfish and bull trout, while affected by the proposed action and other cumulative actions, can be evaluated through a surrogate species such as surf smelt. While not a perfect surrogate, this approach allows for a more comprehensive analysis as discussed above.
69
While snowy plover may be affected by the placement of new aquaculture in breeding areas or designated critical habitat for this species, activities currently do not occur within these areas and it is expected that they will be precluded in the future.
4.1.2. Geographic Scope of Cumulative Effects Analysis
The geographic area for the proposed action includes the Puget Sound/Salish Sea, Willapa Bay, and Grays Harbor. The Columbia River and coastal beaches are also included but no work is expected to be authorized here under NWP 48. Within this broad area, activities expected to be authorized by NWP 48 are concentrated geographically in Willapa Bay, certain areas of Grays Harbor, southeast Puget Sound, Hood Canal, and several embayments in north Puget Sound including.
The resources identified above extend broadly across the landscape. The geographic focus of the analysis is the State of Washington. Analysis is generally conducted at the watershed scale although effects to some species may extend beyond this scale due to the migratory range of the species. This is discussed in more detail in the sections discussing the individual resources.
The broad geographic area necessarily means that there are potentially many past, present, and future actions that could have some effect on the resources. Consistent with CEQ guidance for conducting cumulative effects analysis, the analysis is focused only on those actions with the greatest potential for meaningfully affecting the identified resources.
4.1.3. Temporal Scope of Cumulative Effects Analysis
The timeframe for cumulative effects analysis typically first considers the timeframe for the proposed action, which in this case is five years (CEQ 1997). Under the 404(b)(1) guidelines, the period of analysis is specifically defined as the expiration date of the General permit (40 CFR 230.7b3). This permit will expire in 2022. Effects of the action would then begin to dissipate after 2022. However, while the timeframe of the permit itself is five years, the work itself and more importantly its effects are expected to continue well beyond 2022. As was the case with the 2012 NWP 48 that preceded it, the 2017 NWP 48 is likely to be reissued in 2022 which means most if not all of the activities authorized under the previous permit along with additional new project area will be reauthorized in the future. Thus while the activities authorized under the 2017 NWP 48 permit will cease to be authorized in 2022, the activities themselves will most assuredly continue and be subsequently authorized by the next version of NWP 48 in 2022. Prior permittees typically have a one year grace period to apply for and be authorized under the reissued permit. It would be the unusual case for aquaculture acreage to decrease in this currently expanding industry.
As discussed above, the focus of cumulative effects analysis is on the resource itself. Effects to resources would continue with the reissuance of the NWP 48 in 2022. An analysis of cumulative effects under NEPA must therefore consider this additional work because it results in continued if not expanded impacts on the resource. The reissuance of NWP 48 in 2022 represents a set of potential future cumulative impacts, much the way climate change could result in cumulative impacts.
Whether a 2022 version of the NWP 48 is considered part of the proposed action or a separate action unto itself, its cumulative effects must still be evaluated according to eth CEQ guidelines (CEQ 1997).
While there may be modifications to the reissued permit in 2022, these are anticipated to be minor and
70
all activities permitted in 2017 would also likely be eligible for the 2022 NWP 48, and subsequent versions of NWP 48. Selecting an appropriate timeframe for the analysis is somewhat arbitrary given that the aquaculture work is not expected to end but is instead expected to continue and become a more or less permanent feature of the environment. Aquaculture has been occurring on the landscape for over 100 years. The analysis therefore assumes that the work will continue and not end in 2022 upon the expiration of the 2017 NWP 48.
4.2. Eelgrass
The following summary of eelgrass and its ecosystem value is from WDNR 2015:
Eelgrass (Zostera marina) is an aquatic flowering plant found in fine grained intertidal and subtidal habitats. It provides numerous high-value regional ecosystem services within the coastal ecosystem. It creates structural complexity and supports high levels of biodiversity. Eelgrass serves as a focal habitat for perhaps hundreds of species in the Sound (Thom et al. 2011). It provides nursery habitat for economically important Dungeness crab and Pacific salmon (Fernandez et al. 1993, Phillips 1984, Simenstad 1994); spawning substrate for Pacific herring (Penttila 2007); and foraging habitat for numerous water birds including black brant. Eelgrass improves water quality by trapping and storing particulates and nutrients (Short and Short 1984, Gacia et al. 1999, Asmus & Asmus 2000); enhance productivity and alter nutrient cycling (Hemminga and Duarte 2000); mitigate wave energy and increase shoreline stabilization (Koch et al. 2006); and serve as a globally significant carbon sink (Fourqurean et al. 2012). Given the significance and diversity of the ecosystem functions and services provided by seagrass, Costanza et al. (1997) determined seagrass ecosystems to be one of Earth’s most valuable.
Natural conditions (especially water quality) play a significant role in controlling the distribution of eelgrass. Eelgrass meadows in Puget Sound are characterized by substantial interannual variability that appear to be related to the occurrence of El Niño climate events (Shafer 2015). Eelgrass areas on the Pacific coast can expand by as much as 5 meters (m) and contract by as much as 4 m annually (WDNR 2012).
4.2.1. Eelgrass status
Eelgrass (Z. marina) is protected by a number of Federal and State regulations as discussed below.
- Under the Magnuson-Stevens Fishery Conservation and Management Act (MSA), seagrasses, specifically native eelgrass, are designated as an essential fish habitat (EFH) habitat area of particular concern (HAPC) for Pacific Coast groundfishes and Pacific salmon (Chinook, coho, and pink) in Willapa Bay, Grays Harbor, and Puget Sound. HAPC designations are used to provide additional focus for conservation efforts. This indicates NOAA may have conservation recommendations to ensure projects do not harm bottom-dwelling fish if seagrasses are adversely affected by proposed actions.
- Aquatic vegetation, which includes eelgrass, is a primary constituent element for designated critical habitat for several species listed under the Endangered Species Act including Puget Sound Chinook salmon (70 FR 52630), Hood Canal summer run chum salmon (70 FR 52630), and Puget Sound steelhead (78 FR 2726). A programmatic ESA consultation for shellfish activities
71
including aquaculture concluded that terms and conditions restricting aquaculture in fallow areas were required to protect eelgrass (NOAA 2016).
- Eelgrass is considered a “special aquatic site” under the Clean Water Act (40 CFR 230.43). Special aquatic sites are “geographic areas, large or small, possessing special ecological characteristics of productivity, habitat, wildlife protection, or other important and easily disrupted ecological values. These areas are generally recognized as significantly influencing or positively contributing to the general overall environmental health or vitality of the entire ecosystem of a region” (40 CFR 230.3 (q-1)). “From a national perspective, the degradation or destruction of special aquatic sites, such as filling operations in wetlands, is considered to be among the most severe environmental impacts covered by these Guidelines. The guiding principle should be that degradation or destruction of special sites may represent an irreversible loss of valuable aquatic resources.” (40 CFR 230.1(d))
- According to EPA (2016): The objective of the CWA is to restore and maintain the chemical, physical, and biological integrity of the Nation’s waters. Toward achievement of this goal, the CWA prohibits the discharge of dredged or fill material into waters of the United States unless a permit issued by the Army Corps of Engineers or approved State under CWA Section 404 authorizes such a discharge. For every authorized discharge, the adverse impacts to wetlands, streams and other aquatic resources must be avoided and minimized to the extent practicable. For unavoidable impacts, compensatory mitigation is required to replace the loss of wetland and aquatic resource functions in the watershed. Compensatory mitigation refers to the restoration, establishment, enhancement, or in certain circumstances preservation of wetlands, streams or other aquatic resources for the purpose of offsetting unavoidable adverse impacts. Zostera marina is listed on the 2016 Wetland Plant List for the State of Washington (Lichvar et al. 2016).
- Native eelgrass is considered a ‘saltwater habitat of special concern’ by the State of Washington
(WAC 220-660-320). In administering the Hydraulic Project Approval (HPA) process, the Washington Department of Fish and Wildlife (WDFW) requires applicants to: 1) avoid impacting eelgrass, 2) minimize unavoidable impacts, and 3) mitigate for any impacts (WAC 220-660-350) (WDFW 2008, WDNR 2015).
- WDNR’s aquatic leasing program recognizes the regional ecosystem services provided by eelgrass beds and emphasizes impact avoidance during authorization of uses of state-owned aquatic lands to protect the sensitive aquatic habitat from disturbance (WDNR 2015).
Under the Washington State Shoreline Management Act, which implements the Coastal Zone
Management Act on 1972, the state is requiring updates of all local Shoreline Master Programs (SMPs). They developed guidelines for the development of the SMPs the local jurisdictions must follow in order for their SMP to be approved by the State. These guidelines have specific protections for eelgrass as described below.
- WAC 172-32-186(8) directs SMPs to “include policies and regulations designed to achieve no net loss of those ecological functions”. WDOE (2010) indicates that “the no net loss standard is designed to halt the introduction of new impacts to shoreline ecological functions resulting from new development. Both protection and restoration are needed to achieve no net loss.”
72
- Protecting critical saltwater habitats is important to achieving no net loss of ecological functions. The SMP Guidelines state, “Critical saltwater habitats require a higher level of protection due to the important ecological functions they provide” [WAC 173-26-221(2)(c)(iii)(A)]. Critical saltwater habitats include “…all kelp beds, eelgrass beds, spawning and holding areas for forage fish, such as herring, smelt and sandlance; subsistence, commercial and recreational shellfish beds; mudflats, intertidal habitats with vascular plants, and areas with which priority species have a primary association” (WAC 173-26-221(2)(c)(iii)(A)).
The SMP guidelines include specific provisions for aquaculture including:
- The SMP Guidelines state that aquaculture “should not be permitted where it would adversely impact eelgrass … Impacts to ecological functions shall be mitigated according to the mitigation sequence described in WAC 173-26-201 (2)(e)” .(WAC 173-26-241(3)(b)(i)(C)).
- Local governments should require buffers in order to avoid impacts to eelgrass and require monitoring to ensure the buffers are adequate (WDOE 2015).
- WDNR will establish eelgrass buffers on state managed aquatic lands based on individual site assessments in order to ensure environmental protection of state-owned aquatic resources (WDOE 2015).
The Puget Sound Partnership (PSP), a state agency leading the region’s collective effort to restore and protect Puget Sound, identified eelgrass as an indicator of the health of Puget Sound in recognition of the regional ecosystem services it provides and its sensitivity to changes in environmental conditions. PSP established a goal to increase eelgrass area by 20 percent relative to the 2000-2008 baseline of approximately 53,300 acres by 2020.
4.2.2. Historical context and past effects
The historical distribution of eelgrass in Puget Sound, Willapa Bay, and Grays Harbor is unknown. Available information on past effects is discussed below for each region.
The global literature strongly points to the overriding influence of human population driven land use changes and management practices in causing the loss of seagrasses (Thom et al. 2011). Surveys of local stakeholders identified dredging/filling, shoreline development, water quality, and commercial aquaculture as the most significant stressors on eelgrass (Thom et al. 2014). In Puget Sound, substantial losses are believed to be due to physical changes in shorelines, periodic physical disturbances, and degradation in water quality (Thom and Hallum 1990; Thom 1995; Dowty et al. 2010; Thom et al. 2011).
Eelgrass requires certain environmental conditions including appropriate tidal elevation, light, temperature, salinity, substrata, nutrients, waves, and current velocities (Philips 1984, Thom 2003, Koch 2001).
The WDNR contracted with Pacific Northwest National Laboratory to summarize and rank known stressors to eelgrass in Puget Sound. The summary of stressors on native eelgrass in Figure 4-1 is reproduced from the final report (Thom et al. 2011). The focus of the review was Puget Sound but the analysis is relevant to Willapa Bay and Grays Harbor to the extent the identified stressors occur. The results have been used to develop an eelgrass recovery strategy in Puget Sound (WDNR 2015).
73
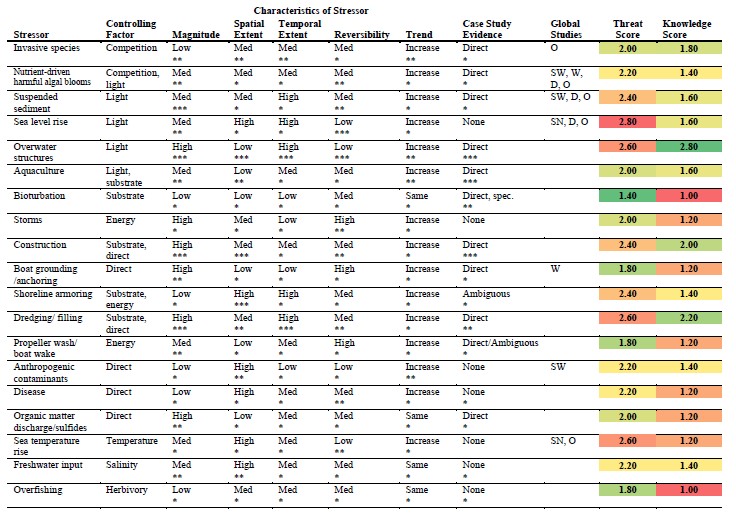
Figure 4-1. Eelgrass stressor ranking table (from Thom et al. 2011). The stressor score is determined by assigned point values to stressor characteristic values. For most categories, High = 3, Medium = 2, and Low = 1, with the exception of the Reversibility category, in which High = 1 and Low = 3 (because high reversibility reduces the threat presented by a stressor). The final stressor score is the mean of all of the points for each stressor, with a value of 3 (red) indicating the highest possible threat to eelgrass and 1 (green) the lowest. All columns included are currently weighted equally in the calculations. The knowledge score is the mean number of asterisks assigned to each stressor (not including case studies). A high knowledge score (3, green) indicates the most information is available about the stressor, while a low score (1, red) indicates very little information is available.
Puget Sound
The following impacts to eelgrass have occurred in Puget Sound:
- Over the last 150 years river deltas have experienced a large loss in area and shoreline, tidal wetlands decreased by 56%, several small embayments have been eliminated and many beaches and bluffs have been modified as a result of shoreline armoring (Simenstad et al. 2011, Fresh et al. 2011). These have all contributed to losses of eelgrass. Eelgrass meadows have been lost due to diking, filling and dredging, but overall changes in Puget Sound have not been assessed due to a lack of comprehensive early records (Thom and Hallum 1990, WDNR 2015, Shelton et al. 2016).
74
- Historical information that does exists indicates that there have been eelgrass losses in Bellingham Bay (34 ha or 30% of the original mapped total) and the Snohomish River delta (70 ha, minimum of 15% lost) due primarily to filling and dredging (Thom and Hallum 1990). Padilla Bay eelgrass increased from 598 to 1541 ha possibly due to the diversion of the Skagit River away from the Bay (Thom and Hallum 1990). A survey of local stakeholders resulted in Figure 4-2 which illustrates areas with historical eelgrass but that were now absent of eelgrass (Thom et al. 2014).
- Though Olympia oysters currently are found throughout their historic distribution, less than 4 percent of historic core populations remain in Puget Sound. Approximately 155 acres remain, compared to 4,000-5,000 acres that historically supported dense assemblages of oysters (NOAA 2011). It is uncertain if the loss of oyster reefs provided an opportunity for eelgrass to expand as has been suggested in Willapa Bay (Blake and Ermgassen 2015), but this is certainly possible.
- Anecdotal accounts indicate widespread declines in eelgrass in certain areas over the last 30-40 years (Thom and Hallum 1990). In these cases, changes in water quality are suggested as the reason for the decreases.
- The invasion of Z. japonica has probably affected the native Zostera at the upper limits of its distribution. These species co-occur at the +0.3 to 1.0 m MLLW elevation on flats, and competition for space has been demonstrated (Harrison 1976). In addition, Z.japonica can invade newly created bare patches within native Zostera meadows, and hold this space for a considerable amount of time (Michele Nielsen, University of British Columbia, conversation, 5 May 1990, in Thom and Hallum 1990). The WDNR sampling program has sampled 378 sites in the greater Puget Sound and Z. japonica has been identified at 68 of those sites (Mach et al. 2010). The author indicates this likely underestimates the presence of Japonica because the sampling is not comprehensive.
- There has been a decadal decline in eelgrass at the Skagit River delta, which has been identified as a priority for future restoration. Research has shown that most of the fluvial sediment delivered to the delta is currently exported offshore by channelized dike complexes. This has led to fragmentation of the eelgrass beds and degradation of other valued nearshore components (Grossman 2013, in WDNR 2015).
- Aquaculture has occurred in Puget Sound for many years. The effects of oyster culture on eelgrass have been discussed previously. In addition to these effects, West (1997) indicated that eelgrass was considered a nuisance species and was routinely removed by oyster growers in Puget Sound.
- In the more recent past Shelton (et al. 2016) indicates that over the past 40 years, eelgrass in Puget Sound has proven resilient to large-scale climatic and anthropogenic change. They indicate that substantial changes to eelgrass populations occur at the site and subsite level with no large scale trends and emphasize the role of local site specific drivers on eelgrass changes.
- Notable increases in eelgrass area occurred at two river deltas following major restoration projects: the Skokomish River delta (200 acres) in southern Hood Canal and the Nisqually River
75
delta in southern Puget Sound. Eelgrass gains at these deltas contrast sharply with nearby sites (WDNR 2015).
WDNR has conducted annual surveys of eelgrass in Puget Sound. These data indicate that Puget Sound native eelgrass area has been stable over the 2002-2013 monitoring record (WDNR 2015). There are no significant 11 year trends although there is some evidence of a general increase in eelgrass area between 2010 and 2013. Localized areas have seen both increases and decreases in eelgrass area.
WDNR estimates the long term average (2000-2013) eelgrass acreage is 22,000 ha (54,000 acres) (WDNR 2015). In 2013, WDNR estimated 22,610 ha (55,870 acres).
76

Figure 4-2. Areas identified as having previously contained eelgrass but currently is absent (from Thom et al 2014).
Willapa Bay
The historical coverage of eelgrass in Willapa Bay is unknown. However, the nearshore habitat in all three areas has been substantially altered since the mid-1800s.
Historical impacts to eelgrass include:
77
- Willapa’s shoreline has been modified by filling and diking (Fish and Wildlife Service (1970, cited in Philips 1984, Ruisink et al. 2006). An estimated 64% of estuarine wetlands have been lost from Willapa Bay (CRA 2007). Borde (2003) estimates that Willapa Bay tidal marsh decreased 36% between 1905 and 1974. It is unknown how much former eelgrass habitat has been lost. Fish and Wildlife Service (1970, cited in Philips 1984) indicate that deteriorating water quality from draining of fresh water marshes and construction of lagoon housing also impacted eelgrass.
- The impacts of diking and sediment loading from logging peaked by the mid-20th century and have since been constant or declined (Fish and Wildlife Service 1970, cited in Philips 1984, Ruisink et al. 2006)
- Historically, the Corps maintained dredged channels at the mouth of Willapa Bay, from the Bay entrance to Raymond, to Bay Center, and mooring areas in Tokeland and Nahcotta. Dikes and breakwaters were constructed. Channel deepening likely resulted in erosion of tidelflats/shallow subtidal areas along the margins of the dredged channel making them less habitable for eelgrass. This was observed in Grays Harbor (Borde et al 2003).
- Historical dredging has impacted eelgrass (Fish and Wildlife Service 1970, cited in Philips 1984). Prior to 1977, the Corps dredged 300,000 cy per year in Willapa Bay (Philips and Watson 1984). Historically, dredged spoils were disposed upland and in open water. The cumulative volume discharged to all the Willapa Bay open water disposal sites from 1996 to 2015 was 539,572 cy (Corps-DMMP 2016).
- construction of bulkhead, pier, and shoreline facilities., (Fish and Wildlife Service (1970, cited in Philips 1984)
- pollution from domestic waters, agricultural runoff, debris from log storage, wood chips (Fish and Wildlife Service (1970, cited in Philips 1984)
- invasion of non-native eelgrass (Z. Japonica) in the 1930s (Borde 2003). It generally occurs at higher tidal elevations but competes for space with Z. marina at the upper end of the Z. marina tidal range (refs). This species is currently the subject of control efforts that are discussed below. Harrison and Bigley (1982) estimated 17,000 ha of Z. japonica on intertidal flats in Willapa Bay. Ruesink et al. (2010) reported that, as of 1997, Z. marina occupied 9.6% of Willapa Bay and Z. japonica occupied 7.7%. Ten years later, in a 2006/2007 survey of Willapa Bay, Dr. Dumbauld with the U.S. Department of Agriculture (USDA) estimated that there were approximately 13,762 acres of Z. marina (15.6% of Willapa Bay) and 12,183 acres of Z. japonica (13.8% of Willapa Bay) (Dumbauld and McCoy 2006/2007). This did not include any acres with thinly populated Z. japonica. To illustrate that Z. japonica distribution in Willapa Bay is thought by some to be expanding, an estimation of Z. japonica distribution was conducted in 2012 using anecdotal data to estimate that 18,000 acres of Z. japonica occurred in Willapa Bay (WDOE 2014).
- Invasion of non-native cordgrass (Spartina alterniflora) which traps sediment and converts mudflat to salt grass.
78
- Damming and regulation of the Columbia River has greatly decreased sediment and freshwater inputs to the estuary (Borde et al 2003). Land use changes including forestry and agriculture increased siltation.
- Oyster culture began in the late 1800s in Willapa Bay to replace the overharvested native Olympia oyster population and continues to the present time. The effects of oyster culture on eelgrass have been discussed previously.
- In Willapa Bay, significant intertidal and shallow subtidal habitat was covered by Olympia oysters which likely competed with eelgrass for space although they also were reported to grow together (Blake and Zu Ermgassen 2015). Historical estimates for the area covered by oyster reef range up to 6,225 ha (15,382 acres) (ermgassen 2012 in Blake) and 9,774 ha (24,152 acres) or 27% of the bay bottom, to 3,141 ha (7,762 acres) (Dumbauld 2011) and 2,600 ha (6,425 acres) or 10% of bay bottom (Ruisink 2006). It is estimated that as much as 27% of the bay bottom could have been oyster bed (Blake and Zu Ermgassen 2015). These oyster beds were subsequently harvested creating an opportunity for eelgrass to expand its range (Dumbauld 2011, Blake ). Areas historically set aside as oyster reserves, that historically contained native oysters, now contain extensive areas of eelgrass (Dumbauld 2011). Dumbauld indicates of the 3995 ha of area historically set aside as oyster reserves, 1393 ha currently contain eelgrass (77% is native eelgrass) (Dumbauld 2015).
Willapa Bay and Grays Harbor are not annually monitored for eelgrass like Puget Sound. Recent trends in eelgrass coverage are not known. Current estimates of eelgrass (Z. marina) in Willapa Bay range from
39,861 acres for Z. marina and Z. japonica combined by WDNR (2001) to 17,000 acres for Z. marina and 9,000 acres for Z. japonica (Dumbauld and McCoy 2015) and 8,461 acres of Z. marina with a similar coverage area for Z. japonica (Ruesick et al. 2006). Borde et al. 2003 indicates that potential eelgrass habitat has increased by 1706 ha based on changes in bathymetry of Willapa Bay.
Grays Harbor
Similar to Willapa Bay and Puget Sound, historical eelgrass area is unknown but Grays Harbor has experienced extensive changes in the nearshore habitat due to diking, filling, and dredging (Borde et al, 2003). Anecdotal observations (Thom) indicated that some flats in the outer (South Bay) area of Grays Harbor were eroded shortly after the navigation channel was deepened in the early 1990s (Borde et al. 2003). Many of the other factors affecting eelgrass including invasion of Z. japonica, declines in water quality, and shoreline construction have also occurred in Grays Harbor. Miller (1977, in Mach et al. 2010) measured a 518% increase in Z. japonica in Grays Harbor from 680 to 4210 acres, though there is little information about its density and abundance across this area.
In recent years WDNR (2001) estimated 36,415 acres of Z. marina and Z. japonica combined in Grays
Harbor. Estimates for Z. marina alone in Grays Harbor ranged from 11,700 acres (Wyllie-Echeverria and Ackerman 2003), and 10,990 acres (Gatto 1978). Borde et al. 2003 indicates that potential eelgrass habitat increased by 1793 ha to 3099 ha based on changes in bathymetry of Grays Harbor between 1883 and 1956 (e.g., from a general deepening of the bay). It is unknown whether this translated to an actual increase in eelgrass. It is suggested that the change in bathymetry may be due to decreases in sediment supply from the Columbia River and dredging within the Bay.
79
4.2.3. Effects of the proposed action
The effects of the proposed action are discussed above in Section 3. In general the action will result in continued degradation/loss of eelgrass in areas that have been engaged in ongoing aquaculture, and new eelgrass degradation/loss in areas currently classified as fallow or project are that is not currently engaged in aquaculture but is expected to be put into aquaculture during the next five years. These project areas have no conditions or restrictions on conducting work in eelgrass. New project area, area that has never had historical aquaculture or is not part of holdings by an existing aquaculture farm, can impact up to a half acre of eelgrass. It is uncertain what degree this condition would affect shellfish activities in Washington State because of the many areas have been engaged in some form of aquaculture historically (including tribes) and the many existing growers/farms would likely not be restricted by this because any new areas they obtained could be absorbed into their larger project area. For purposes of this analysis it is assumed the half acre eelgrass impact restriction would have negligible relevance and offer negligible protection to eelgrass resources for the reasons stated above.
The current known distribution of eelgrass within the geographic area is illustrated in Appendix A.
Table 4-3. Estimated acres of eelgrass affected by the proposed action
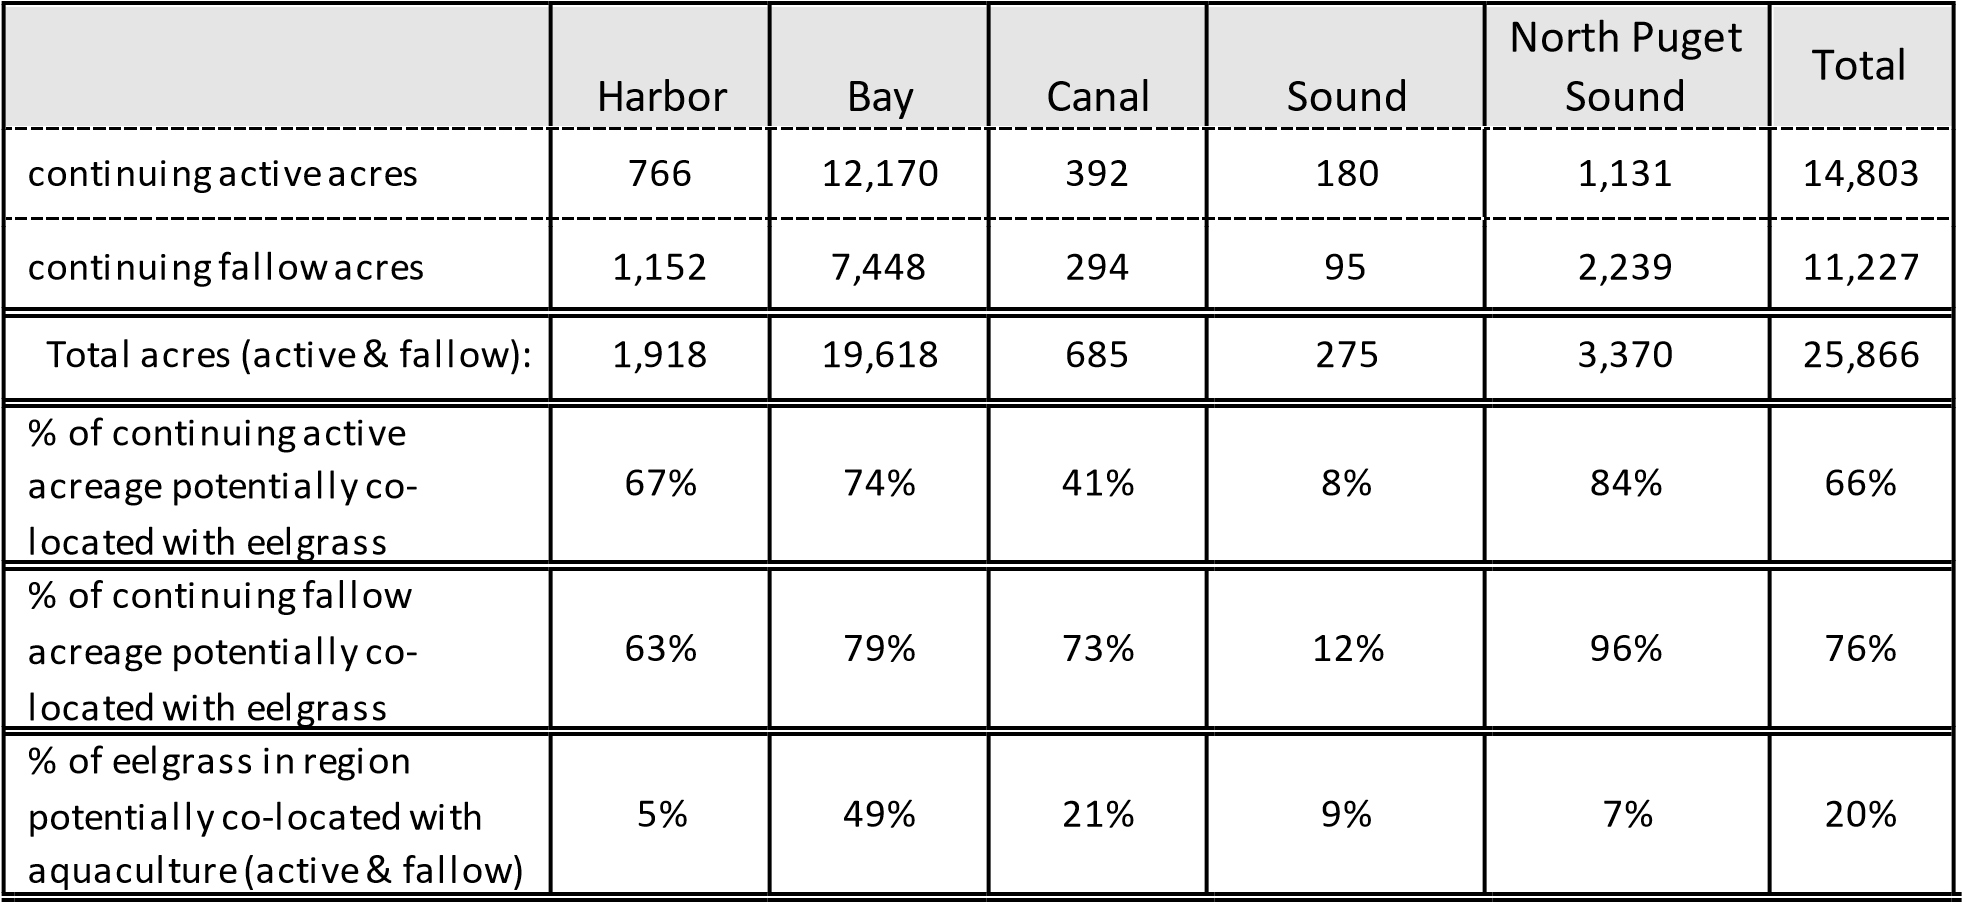 Grays Willapa Hood South Puget
Note: Eelgrass coverage estimates for Willapa Bay and Grays Harbor are likely high by a factor of 3 due to dated WDNR surveys using less accurate methods and that include Z. japonica.
4.2.4. Effects of other present day actions
Development and urbanization
Commercial and residential development produce a number of stressors to eelgrass including construction such as dredging and filling that physically removes eelgrass, overwater structures that shade eelgrass, and water quality impacts that negatively affected eelgrass. Current population density
(Figure 4-3) identifies where many of these stressors are concentrated currently. Visual analysis of Figure 4-3 illustrates the impact of urbanization of eelgrass. While eelgrass generally exists throughout the geographic area, there are noticeably less areas in along the urbanized east side of Puget Sound and
80
Kitsap County. Eelgrass is noticeably deficient in the southern reaches of Puget Sound. This is likely due to the low tides that occur during mid-day during the summer which desiccates eelgrass decreasing its productivity and survival (ref).
81
Figure 4-3. 2010 population density in western Washington State and mapped eelgrass
82
Outfalls and Nutrients
In Puget Sound, it is estimated the average annual dissolved inorganic nitrogen (DIN) loading from anthropogenic sources is 2.7 times the natural loading conditions (Mohamedali et al. 2011). Annual DIN loads were greatest in the main basin of Puget Sound and almost entirely a result of discharge from residential wastewater treatment facilities (Mohamedali et al. 2011). The DIN loads between Edmonds and the Tacoma Narrows bridge, an area with the greatest concentration of outfalls (Carmichael et al. 2009), were 3.6 times the average for greater Puget Sound, an area not including the Straits
(Mohamedali et al. 2011). The continued addition of DIN in excess of natural conditions will likely shift the carbon and nutrient balance in Puget Sound and develop conditions (e.g., eutrophication) less suitable for eelgrass (Gaeckle 2012). It has been shown that the construction of outfalls and the discharged effluent affect marine organisms and processes, and specifically eelgrass. The impacts to eelgrass range from physical effects on the environment where it grows to physiological effects on the plants. But little is known about these impacts in Puget Sound (Gaeckle 2012).
The areas within Puget Sound where eelgrass is most at risk include locations along the eastern side of the Sound where population density is highest (e.g., urban growth areas), near outfall discharge points, and at the mouths of major rivers. However, the major outfall discharge points that would be a direct source of contamination for eelgrass typically discharge deeper than the extent of existing eelgrass beds in Puget Sound (e.g., West Point Wastewater Treatment Plant, Brightwater Treatment Plant). Most other treatment facilities in Puget Sound discharge at or beyond the deepest extent of eelgrass (Gaeckel et al. 2015).
Other discharge points of concern include CSO and stormwater outlets. These sources typically discharge near eelgrass beds and tend to contain high concentrations of nutrients, metals, and contaminants. CSOs are mostly contained in areas of high population density near major cities most of which have eelgrass growing along the waterfront.
Another area of concern where eelgrass may be affected includes major river deltas that have high flow and sediment discharge and contain inputs from sewage treatment facilities among other upland sources. Eelgrass is currently growing at most of the major river deltas but restoring historical flow volumes, drainage patterns and filtration potential may enhance eelgrass across deltaic fronts (Grossman 2013, Grossman et al. 2011). In addition, improvements in sewage treatment will only enhance riverine water quality and provide a range of benefits downstream and into the Sound.
The potential effect on eelgrass from the quantity of outfalls (and associated loading) in the Central Puget Sound and Saratoga-Whidbey basins could be detrimental to eelgrass considering the anticipated population growth over the next decade (Gaeckel et al. 2015).
Outfall impacts to eelgrass range from physical effects on the environment where it grows, such as the installation of an outfall pipe, to physiological effects on the plants caused by shading due to nutrient triggered plankton blooms or compromised photosynthetic potential because of metal or contaminant toxicity (Lewis and Devereux 2009). Effects of anthropogenic containments in general are uncertain as limited study has occurred to date (Gaeckle 2016).
83
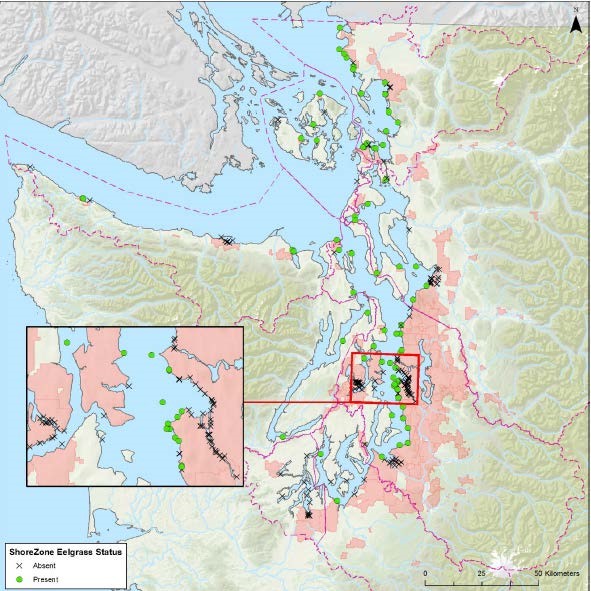
Figure 4-4. NPDES permitted outfalls in Puget Sound and eelgrass presence in adjacent shoreline segment from WDNR Shoreline inventory (2001). Figure reproduced from Geackel et al. 2015.
Nutrient (nitrogen and phosphate) concentrations have been increasing in Puget Sound. The reasons for this are uncertain but WDOE hypothesizes that human derived nutrients due to summer inputs by waste water treatment plants increases nitrogen in the summer when natural inputs from rivers typically decrease (Figure 4-5). This affects the nutrient balance of the food web and may be causing algal blooms (Roberts et al 2013). The presence of macroalgal blooms in particular is identified as a stressor for eelgrass due to deposition of masses of macrolgae directly on eelgrass. The role of phytoplankton blooms is less certain but could increase turbidity and reduce eelgrass health and growth (Thom et al.
2011). The quantitative effect on eelgrass is not known.
84
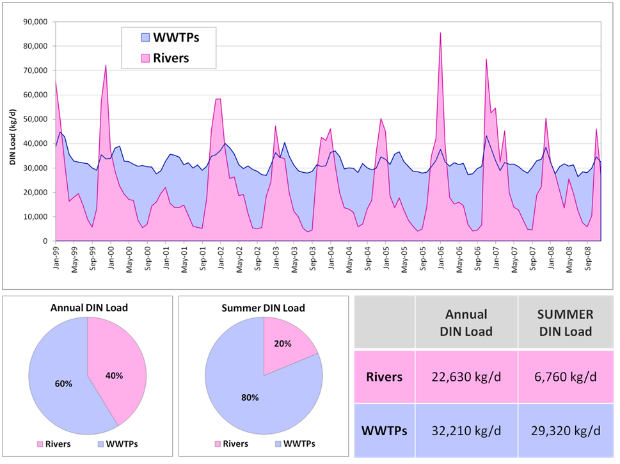
Figure 4-5. Dissolved inorganic nitrogen (DIN) input to Puget Sound from local rivers and water water treatment plants (WWTPs).
Herrera (2011) found that during storm events, median total nitrogen concentrations were higher in residential and agricultural subbasins (1.3 and 1.8 mg/L, respectively) relative to commercial/industrial and forested basins (0.3 and 0.4 mg/L, respectively). Increased development relative to forested basins is likely to increase nitrogen loads.
The deposition of organic matter in the nearshore if thick enough can result in sediment porewater becoming anaerobic. This produces hydrogen sulfide which is toxic to eelgrass (Thom et al. 2011). This can from storm water, log rafting, tree debris, and macroalgae piles. The extent of this in Puget Sound is expected to be low (Thom et al, 2011).
Disease
Wasting disease has been observed in eelgrass populations throughout most of Puget Sound (Thom et al 2011). It appears to not have a detrimental effect on survival of these populations, but there is limited information. Thom et al. 2011 suggests the disease may increase with expected changes in sea temperature and salinity.
85
Overwater structures
Overwater structures such as docks and piers cause loss of eelgrass by shading, altered wave energy pattern, altered substrate characteristics (Jones and Stokes 2006, Nightingale and Simenstad 2001). An inventory of overwater structures was conducted by WDNR (WDNR 2007). While the inventory is dated, it provides an indication of the magnitude of the impact. The number of overwater structures and total acres affected are illustrated in Table 4-4.
Table 4-4. Overwater structure inventoried by WDNR from 2002-2006 orthophotos.
|
|
Grays Harbor |
Willapa Bay |
Hood Canal |
South Puget Sound |
North Puget Sound |
|
Number of structures |
133 |
111 |
1156 |
4350 |
2481 |
|
Total acres |
53 |
22 |
174 |
975 |
560 |
Simenstad et al. (2011) estimated that overwater structures cover approximately 6.5 km2 of the Puget Sound intertidal. Thom e al. 2011 estimated an average of 4 ft2 of overwater structure per linear foot of shoreline across Puget Sound, with over 1,400 acres of overwater structures. Central Puget Sound contains the largest area covered by overwater structures and the greatest ratio of overwater structure to linear feet shoreline present. The San Juan region has the lowest density of overwater structures. It was estimated that 40% of the overwater structure area (560 acres) was collocated with eelgrass and thus would be affected (Thom et al. 2011).
Nightingale and Simenstad (2001) concluded that their empirical findings indicate that the cumulative impacts of overwater structures can have significant impacts on ambient wave energy patterns and substrate types. While this conclusion is not specific to eelgrass, these impacts directly affect eelgrass present at these locations.
Effects may be reduced due to increased knowledge of effects leading to care in placement location so as not to disturb eelgrass and/or installation of grating to allow light penetration which reduces the impact (Jones and Stokes 2006). Eelgrasses losses are minimized by WDFW hydraulic code rules that require overwater structures be designed or located to avoid shading or other impacts that could result in the loss of eelgrass (WAC 220-110-300(3) and (4)).
Corps permitting of overwater structures between 2007 and 2016 is illustrated in Figure 4-6 and includes both new structures and maintenance/repair of existing structures.
86
0
20
40
60
80
100
120
140
160
180
2007
2008
2009
2010
2011
2012
2013
2014
2015
2016
LOP
NWP 3
other NWPs
RGP
SP
Figure 4-6. Overwater structure permitting 2007-2016
Mooring buoys, anchors, and barge grounding
Improperly sited or designed mooring buoys and vessel anchoring can scour, shade, fragment, and increase eelgrass bed vulnerability to disturbances. Localized impacts are frequently concentrated within embayments with high densities of moored vessels (WDNR 2015). Barge groundings have damaged eelgrass at the Clinton ferry terminal and at Hood Canal Bridge, as well as smaller scale impacts near marinas (Thom et al 2011). These effects are generally small in scale, but there spatial extent is unknown. Effects are likely to increase as boat traffic increases (Thom et al. 2011). Recent Corps permitting of mooring buoys is illustrated in Figure 4-7.
0
20
40
60
80
100
120
2007
2008
2009
2010
2011
2012
2013
2014
2015
2016
LOP
NWP 1
NWP 3
NWP 9
NWP 10
SP
Figure 4-7. Recent Corps permits issued for mooring buoys in Washington State
87
Dredging projects
Construction projects that affect the substrate or that result in dredging or filling can adversely affect eelgrass. In most cases, project effects to eelgrass are mitigated. A summary of permits issued for nonCorps dredging and maintenance dredging activities conducted under NWPs are summarized in Figure 4-8. Corps maintenance dredging occurs regularly at many locations throughout Puget Sound and in Grays Harbor. Annual dredging in Puget Sound is 100,000 – 200,000 cy which is typically maintenance dredging of the Snohomish or Duwamish Rivers. An average of 1.7 million cubic yards is dredged annually from the Grays Harbor deep draft channel. The dredged material is disposed of at various approved disposal sites, including open-water disposal at the Point Chehalis, South Beach, South Jetty, and Southwest disposal sites, as well as beneficial use for beach nourishment at Half Moon Bay. The Westport Marina and the entrance channel require infrequent maintenance dredging. Annual maintenance dredging by the Corps is likely to continue for the foreseeable future. In addition, the Port of Grays Harbor (Port) conducts maintenance dredging of its marine terminal facilities adjacent to the Federal Navigation Channel (Corps 2012 – GH EA). The Corps is currently deepening the federal navigation deep-draft channel in Grays Harbor from the currently maintained depth of -36 feet MLLW to the fully authorized depth of -38 feet MLLW. The project is deepening approximately 14.5 miles of the 27.5-mile channel. The Port of Grays Harbor requested deepening the channel the additional two feet to better accommodate current vessel traffic for existing Port tenants and commodities. Maintenance dredging in Willapa Bay is currently managed by the Port of Willapa Bay. Maintenance dredging would be expected to have only negligible impacts to eelgrass associated with turbidity during dredging. The primary eelgrass impact would have occurred during the initial dredging of the project. The Port plans to dredge six locations at varying frequencies ranging from annually to every 20 years. The average annualized dredge volume they estimate is 14,000 cy (Shepsis and Chaffee 2012).
0
2
4
6
8
10
12
14
2011
2012
2013
2014
2015
2016
SP
LOP
NWP 3
NWP 35
Figure 4-8. Dredge related Corps permitting 2011-2016
88
Invasive species and control efforts
As described two invasive species, Z. japonica and S. alterniflora, may adversely affect native eelgrass.
Z. japonica occurs throughout Puget Sound, Willapa Bay, and Grays Harbor and competes for space with the native eelgrass (Z. marina). Spartina can also displace eelgrass (Zostera spp.) on mudflats although it typically occurs at higher elevations than the native eelgrass (DOI et al. 1997). Efforts to control both species with herbicides and mechanical methods are ongoing. Herbicides in particular can adversely affect the native eelgrass. These non-target effects are minimized to the degree possible.
The herbicide imazapyr and glyphosate have been used to control S. alterniflora. In Puget Sound, approximately 11.3 solid acres of S. alterniflora, including over 30,000 occurrence points, was treated in Puget Sound. This represents a seven percent increase from the 10.5 solid acres treated in 2014. It is anticipated that treatment efforts will increase in coming years (WSDA 2015). In Willapa Bay over 8,000 solid acres have been eradicated as of 2015. Affected acres in Pacific County have declined to 1,075 representing a 96 percent reduction from the peak of 25,430 affected acres recorded in 2009 (WSDA 2015). The reported amount of imazapyr discharged for Spartina control in Willapa Bay for 2012 was approximately 0.75 pound of active ingredient. In Grays Harbor S. alterniflora has been reduced to 0.0032 solid acre from a high of over ten solid acres in 2005. WSDA projects that less than 0.006 solid acre of S. alterniflora will be present in Grays Harbor County during the 2016 treatment season WSDA 2015).
In 2014, WDOE issued an NPDES permit for shellfish growers to apply imazamox to Z. japonica on clam culture beds only (not authorized for geoduck or oysters) in Willapa Bay. WDOE indicates that mixed beds of Z. marina and Z. japonica will be removed (WDOE 2014). Ecology expected that Z. marina growing off of the treatment site will not be significantly impacted if effective mitigation was employed. Follow-up monitoring indicated that effects to off-site non-target Z. marina were within the acceptable limits (WDOE 2016).
Eelgrass restoration
The Puget Sound Partnership (PSP), a state agency leading the region’s collective effort to restore and protect Puget Sound, identified eelgrass as an indicator of the health of Puget Sound in recognition of the regional ecosystem services it provides and its sensitivity to changes in environmental conditions. PSP established a goal to increase eelgrass area in Puget Sound by 20 percent relative to the 2000-2008 baseline of approximately 53,300 acres by 2020. The WDNR was subsequently tasked, in collaboration with the PSP, to develop a comprehensive recovery strategy for eelgrass. An interdisciplinary workgroup of local, state, and federal government, tribes, non-governmental organizations, and business groups defined overarching goals and prioritized implementation measures to address critical stressors and support conservation and recovery. The eelgrass recovery strategy including the following goals:
- Conserve existing eelgrass habitats and enforce the “no net loss” standard established by the SMP guidelines;
89
- Reduce environmental stressors to support natural expansion, key stressors identified included overwater structures & in-water construction, vessel mooring & anchoring, anthropogenic nitrogen and sediment loading;
- Restore and enhance degraded or declining eelgrass beds;
Successful eelgrass restoration has been difficult to achieve in Puget Sound (WDFW 2010, Thom et al. 2001, Thom et al 2014). New eelgrass beds can be established where conditions that prevent eelgrass from growing (e.g., shade, depth, substrate, or current velocity) are remedied (Thom et al. 2001, Thom et al 2014). An analysis of candidate areas for restoration was produced to support the PSP goal of increasing eelgrass area by 20%. These areas are identified in Figure 4-9.
90

Figure 4-9. Areas identified with eelgrass restoration potential that are currently devoid of eelgrass. Higher eelgrass restoration potential score indicates greater potential (from Thom et al. 2014).
4.2.5. Effects of future actions
The population growth in Puget Sound counties combined is estimated to increase 25% between 2015 and 2040 with growth being fairly equal spread among the counties ranging from 10% in San Juan County to 36% in Whatcom County (WOFM 2012). In general the more urban areas are predicted to
91
have greater population increases than the more rural counties (Figure 4-10). The population growth in Grays Harbor County is estimated to increase 5% between 2015 and 2040 (WOFM 2012). More recent demographic data indicates that Pacific County lost population in 2015 compared to the previous year. The population growth in Pacific County is estimated to increase 6% between 2015 and 2040 (WOFM 2012). More recent demographic data indicates that Pacific County lost population in 2015.
Presently, Willapa Bay remains a rural economy will reliance on marine and resource extraction jobs. This is expected to continue. There is unlikely to be significant habitat restoration actions in the region because there are limited numbers of ESA listed species which traditionally attract restoration dollars (CRS 2007). The aquaculture industry is expected to continue to be a driving influence on the ecology of the bay.
92
Figure 4-10. Expected population growth in the counties surrounding the inland marine waters
93
Future actions were determined in part by examination of local shoreline plan updates which estimate future growth/development and other activities over a planning horizon Table 4-5. Local governments are on different update schedules. Some local governments have completed their comprehensive updates. Others are under way or have not begun.
Table 4-5. Anticipated future actions for county shoreline master plan updates
|
|
Anticipated future activities |
Source |
|
Grays Harbor County |
support expansion of agriculture, encourage expansion of aquaculture, Encourage new water-oriented commercial development, encouirage recreation development |
Preliminary Draft Grays Harbor County Shoreline Master Program August 2016 |
|
Pacific County |
future development is expected to follow the slow pace of development experienced in recent years : Tourism, recreation, residential, aquaculture, and fishing |
DRAFT Cumulative Impacts Analysis Pacific County’s Shoreline Master Program 2015 |
|
Whatcom County |
|
|
|
Skagit County |
residential development- significant in some locations; large amount of industrial property is available for potential future redevelopment |
Cumulative Impacts Analysis of Skagit County’s Shoreline Master Program 2016 |
|
Island County |
residential development, aquaculture, docks/piers limited to areas where currently clustered |
SMP update Cumulative Impacts Analysis 2013 |
|
Snohomish County |
residential infill; dock, pier, or ramp construction, bulkhead development associated with residential use; expanded agricultural use; creation of more parks/public water access sites |
Exhibit A, Amended Ordinance No. 12-025 Snohomish County Shoreline Management Program: Shoreline Environment Designations, Policies and Regulations 2012. Appendix C – Summary of Potential Development Impacts and Proposed Regulatory and NonRegulatory Offsets |
|
King County |
limited residential development |
King County Shoreline Cumulative Impacts Assessment September 2010 |
|
Pierce County |
residential development, new and reconstruction of docks/piers, limited recreational development; aquaculture |
SMP update Cumulative Impacts Analysis 2014 |
|
Thurston County |
residential development |
Final Draft Thurston County Shoreline Master Program Update Inventory and Characterization Report SMA Grant Agreements: G0800104 and G1300026 June 30, 2013 Prepared By: Thurston County Planning Department |
94
|
Mason County |
residential development |
Mason County SMP Cumulative Impacts Analysis: February 2016 |
|
Kitsap County |
residential development; limited commercial development |
Revised DRAFT Cumulative Impacts Analysis for Kitsap County’s Shoreline Master Program 2013 |
|
Jefferson County |
“residential development, master planned Resorts, marinas, co |
|
Increased development is expected to lead to increases in the impacts discussed under the previous section including increases in nutrients degrading water quality conditions for eelgrass, increases in overwater structures, increased damage from boating and anchoring. Residential development along shorelines typically involves installation of septic systems which results in nutrient addition to marine waters (Pierce CIA, Island CIA). Human-induced disturbances are expected to increase, and may exacerbate, eelgrass loss in Puget Sound (Thom et al. 2014). Efforts by the State to minimize these future impacts are likely to have some beneficial effects at reducing the rate of impact.
Aquaculture
Aquaculture is an important industry in Puget Sound, Willapa Bay, and Grays Harbor accounting for significant percentage of the nation’s shellfish production. The industry is growing and expected to continue well beyond the expiration of the 2017 NWP 48. As the industry expands, more tidelands with and without eelgrass are expected to be put into production. The effects of aquaculture on eelgrass are expected to continue into the future and would not likely cease upon the expiration of the 2017 NWP 48. One geoduck plant-to-harvest cycle can take 7 years which is beyond the 5 year timeframe of a NWP. All active and fallow acreage collocated with eelgrass would continue to impact the eelgrass or remove it entirely at least for periods of time. New areas that are put into culture may or may not be subject to restrictions on eelgrass as discussed previously.
The impacts to eelgrass from aquaculture can be temporary, depending on the activity, because the habitat conditions themselves (elevation, water quality, etc) are not permanently altered which allows eelgrass to eventually recover given sufficient time. The timeframe for recovery has been documented to be 2 to 5 years depending on the activity and other factors. This recovery timeframe may or may not allow for a full recovery of eelgrass before the next aquaculture disturbance. Even for disturbances spaced sufficiently apart, for example on a geoduck farm where geoducks are planted and covered with nets for 2 years before a 5 year period when eelgrass recovery can occur. After 5 years, geoduck harvest disturbs/removes the eelgrass once more. While this process allows for eelgrass recovery at the site, the frequency of disturbance and relatively long recovery times result in a local habitat condition where eelgrass more often than not is either not present or present at a much reduced functional state. This is the future condition of eelgrass on tidelands that are engaged in aquaculture. This effect would persist as long as aquaculture is occurring at the site. In some cases such as when nets are placed over planted clam beds, any eelgrass is likely to be permanently smothered and not recover because of the permanence of the nets which are only removed between harvest and the next planting cycle which may only be a matter of weeks or months. This is insufficient time for eelgrass to recover.
95
Construction Projects
Water clarity in nearshore areas is often reduced by the presence of suspended sediments, which can reduce the light input to eelgrass beds below that required for eelgrass growth. Studies in Puget Sound and elsewhere document that suspended sediments from land use actions can increase nearshore turbidity for extended periods (Thom et al. 2011).
A summary of all RHA Section 10 and CWA Section 404 activity permitted by the Corps in recent years is illustrated in Figure 4-11. This level of permit activity is expected to continue in the future. In most cases effects to eelgrass from these activities would avoided, minimized, or mitigated consistent with Washington State regulations.
0
20
40
60
80
100
120
140
160
180
200
2008
2009
2010
2011
2012
2013
2014
2015
2016
LOP
SP
Figure 4-11. RHA Section 10 and CWA Section 404 standard permits and LOPs for all activities 20082016
Proposed new construction projects include:
- Shell Anacortes Rail Unloading Facility. Equilon Enterprises, LLC, dba Shell (the Applicant), is proposing to construct and operate a crude-by-rail unloading facility at the existing Shell Puget Sound Refinery (PSR) in Anacortes, Washington. Each unit train arriving at the rail unloading facility would carry approximately 60,000 to 70,000 barrels of crude oil. The facility would receive six unit trains per week, with each train having up to 102 tank cars. The proposed project would not result in a change in refining capacity of the Shell PSR (EIS _Wdoes website). The project is currently being revised.
- Westway proposes expanding its existing bulk liquid storage terminal to allow for the receipt of crude oil unit trains, storage of crude oil from these trains, and shipment of crude oil and other materials by vessel and/or barge from Port of Grays Harbor Terminal 1. According to the project proposal, the Westway expansion project would be done in two phases. The information below
96
includes the proposed construction and operations for both phases. First phase would increase rail line traffic by 730 rail trips (loaded and unloaded) per year and vessel traffic in Grays Harbor by approximately 400 vessel trips per year. The second phase would increase PS&P rail line traffic by 365 rail trips (loaded and unloaded) per year and vessel traffic in Grays Harbor by approximately 120 vessel trips per year (City of Hoquiam and WDOE 2016). The proposed action is currently being revised. EIS identified potential impacts to eelgrass as a result of changes to grain size and turbidity. Increased vessel traffic may impact eelgrass on the margins of the channel
Climate change
Both sea level rise and warmer water temperatures are predicted to occur in the future as a result of climate change in Washington State (WDOE 2012). Sea level rise would result in increased depth and light attenuation may contribute to vulnerability of eelgrass and/or result in eelgrass decline at the lower edges of beds. The response of eelgrass may be to move upslope if there are suitable areas available. Although a higher sea level will probably affect eelgrass, the actual effect is very uncertain, and will interact with stressors that act upon water clarity (Thom et al. 2011). Predicted effects to eelgrass include loss of two-thirds of the low tidal areas in Grays Harbor and Willapa Bay, and increased sediment from beach erosion could impact eelgrass (WDOE 2012).
Extended periods of high temperatures reduce eelgrass growth and survival (Thom et al. 2011, WDNR 2010). In places where the water warms substantially in the summer (e.g., poorly flushed shallow bays) small increases in the temperature would result in loss of the plants. Increasing or consistently warm water temperatures in conjunction with low oxygen conditions or anoxic events may preclude growth and survival of Z. marina (WDNR 2010).
4.2.6. Summary and Conclusion
Eelgrass (Z. marina) is included in this analysis because it plays a key role in the aquatic ecosystem, is considered a protected species by the Federal government and the State of Washington, is the focus of significant restoration, monitoring, and planning initiatives, and the proposed action has substantial adverse impacts on this species.
The cumulative impacts on eelgrass are summarized in Table 4-6 for the geographic regions analyzed. Table 4-6. Summary of stressors and primary cumulative effects on native eelgrass (Z. marina)
|
stressor |
Puget Sound |
Willapa Bay |
Grays Harbor |
|
Invasive species |
Z. japonica is widespread (acreage unknown); acreage impact on Z. marina is unknown but considered limited |
Z. japonica is widespread (18,000 acres); herbicide currently used to control which has adverse effects on Z. marina where the two are collocated |
Z. japonica is widespread (4,210 acres); |
|
Nutrient driven harmful algal blooms |
nutrients and algal blooms are increasing; further increases are expected due to increased population and development; acreage impact |
significant increasing nitrate trend; effect uncertain |
no significant nutrient trends |
97
|
Suspended sediment |
historical effects likely from logging and development; increasing nearshore development may increase future suspended sediment |
historical effects likely from logging and development; some current high sediment loads documented, uncertain effects |
historical effects likely from logging and development; limited future effects |
|
Climate change |
Sea level rise may cause shifts in eelgrass up slope provided habitat is available – net effect uncertain; future increases in water temperature may reduce productivity and survival |
||
|
Overwater structures |
numerous and increasing; new standards for light penetration decrease future effects; estimated 560 eelgrass acres affected |
limited in extent |
limited to few developed locations |
|
Historical oyster harvest |
4-5,000 acres of Olympia oyster reef lost, eelgrass may have replaced to some degree although this is unknown |
6-24,000 acres of Olympia oyster reefs lost, eelgrass has colonized many of these former oyster reef areas |
Unknown |
|
Aquaculture |
widespread historical impacts; large acreages (> 4,000) potentially impacted by proposed action, and by future expected aquaculture |
widespread historical impacts; large acreages (20,000) potentially impacted by proposed action and by future expected aquaculture |
widespread historical impacts; large acreages (2,000) potentially impacted by proposed action, and by future expected aquaculture |
|
Storms |
can have large impact; eelgrass typically recovers quickly because the underlying conditions that created the habitat conditions in the first place remain the same; negligible long term impact |
||
|
Construction projects |
historical impacts; future impacts likely to be mitigated based on current regulations |
historical impacts; future impacts likely to be mitigated based on current regulations |
historical impacts; future impacts likely to be mitigated based on current regulations |
|
Boat grounding/ anchoring |
Large boating population that is increasing which suggests continued impacts; spatial extent likely limited |
Limited effects |
Limited effects |
|
Propeller wash/ boat wake |
Likely to be limited in extent |
|
|
|
Shoreline armoring |
Historical and likely continuing impacts although not clearly documented |
Some limited historical impacts likely |
Some limited historical impacts likely |
|
Dredging/ filling |
large unknown acreages lost due to historical filling and dredging; future effects likely mitigated |
||
|
Anthropogenic contaminants |
Contaminants present but effects uncertain |
No effects expected |
Contaminants present but effects uncertain |
|
Disease |
wasting disease present in Puget Sound, effects uncertain |
no known effects |
no known effects |
|
Organic matter discharge/ sulfides |
Likely historical effects due logging; uncertain effects currently but expected to be limited in extent |
Likely historical effects due to logging; future effects not anticipated |
Likely historical effects due to logging; future effects not anticipated |
98
There are historical impacts to eelgrass that are both negative and positive. Substantial losses have occurred due diking, filling, dredging, development, and pollution/nutrients. Historical aquaculture has also negatively impacted eelgrass in all of the regions. In Willapa Bay, the historical harvest and removal of the native Olympia oysters from as much as 25% of the bay allowed eelgrass to expand into this area. The extent of this change is unknown but may be in the 1,000s of acres. This likely occurred in Puget Sound and Grays Harbor as well but at a lesser scale.
Currently the primary adverse effects to eelgrass occur from urbanization/development activities and its associated pollution (primarily in Puget Sound) and aquaculture. Anticipated future impacts include urbanization/development, aquaculture, and climate change related effects. Current less developed areas in north Puget Sound and Hood Canal are expected to see some of the fastest population growth. This is also where the most extensive eelgrass beds occur in the Puget Sound.
Significance
Significance is determined by context and intensity which are defined below. With respect cumulative impacts, 40 CFR 1508.27(b)(7) states, “The following should be considered in evaluating intensity: Whether the action is related to other actions with individually insignificant but cumulatively significant impacts. Significance exists if it is reasonable to anticipate a cumulatively significant impact on the environment. Significance cannot be avoided by terming an action temporary or by breaking it down into small component parts.”
Context
A determination of significance requires consideration of both context and intensity (40 CFR 1508.27(a)). Context means that the significance of an action must be analyzed in several contexts such as society as a whole (human, national), the affected region, the affected interests, and the locality.
Nationally eelgrass has declined dramatically with 90% declines documented both along California and the Atlantic coast (NOAA 2017). It is considered a special aquatic site with protections under the CWA.
Regionally eelgrass is protected by the State of Washington under the Shoreline Management Act and
HPA regulations, and there is stated objective to increase its abundance in Puget Sound by 20% by 2020.
Locally, eelgrass conditions differ among the three geographic areas analyzed as discussed in Table 4-7. Puget Sound has more stressors acting on eelgrass and the State has identified recovery goals for the species. In Willapa Bay, the number of stressors may be less but the relative effect of individual stressors such as competition with the non-native eelgrass and aquaculture may be greater than the effect of those stressors in Puget Sound. Moreover, eelgrass in Willapa Bay may be more extensive today than it was historically, although this is uncertain, due to the large accumulations of Olympia oysters that were present and subsequently harvested. The role of eelgrass locally is also relevant as its importance may be greater if it is located at river mouths where it can provide greater benefits to certain species such as juvenile Chinook salmon. Eelgrass further from river mouths may be less valuable to this species as a rearing habitat simply due to its distance from the salmon migration pattern.
There are a number of affected interests including shellfish growers, fishing interests, salmon recovery interests, tribal communities, NGO’s, natural resource agencies, and development interests. Today shellfish growers are unique in that they are in direct competition with eelgrass and directly affect it. Historically, dredging and other construction projects also directly affected eelgrass but today these
99
types of projects are typically avoided or mitigated. Aquaculture is unique in that its impacts are not mitigated. Indirect effects of development and urbanization and degraded water quality, while likely substantial, are not yet well understood. As knowledge is gained additional restrictions may be imposed to prevent impacts. This has been the case with overwater structures which now typically are required to allow light to penetrate through the structure so as to minimize impacts to eelgrass. The other affected interests mentioned above generally support protection and restoration of eelgrass.
Intensity
The following factors should be considered when evaluating intensity (40 CFR 1508.27). These factors are discussed in the context of cumulative impacts.
- Impacts that may be both beneficial and adverse. A significant effect may exist even if the Federal agency believes that on balance the effect will be beneficial.
Beneficial effects to eelgrass have occurred in Puget Sound through restoration projects.
- The degree to which the proposed action affects public health or safety.
No public health or safety issues are identified.
- Unique characteristics of the geographic area such as proximity to historic or cultural resources, park lands, prime farmlands, wetlands, wild and scenic rivers, or ecologically critical areas.
Eelgrass itself is considered an ecologically critical area by the CWA and the State of Washington.
- The degree to which the effects on the quality of the human environment are likely to be highly controversial.
The concerns surrounding eelgrass have been extremely controversial in the State of Washington as evidenced by recent court cases specifically involving eelgrass affected by aquaculture, interest in public meetings and concerns/comment letters submitted to the Corps expressing concerns for eelgrass. Impacts associated with development also can generate controversy.
- The degree to which the possible effects on the human environment are highly uncertain or involve unique or unknown risks.
There is uncertainty with respect to all elements of the issue including the population of eelgrass itself, past, present, and future effects, and effects of the proposed action. The uncertainty is primarily about the magnitude of effect, however, as there is little debate among the scientific community about the stressors on eelgrass and effects of aquaculture in particular.
- The degree to which the action may establish a precedent for future actions with significant effects or represents a decision in principle about a future consideration.
It is uncertain whether the proposed action will set precedent for future actions; however, there is strong potential for this to occur. The 2017 NWP 48 has been issued twice previously and is likely to be issued again in 2022. Each iteration of the permit has been updated based on experiences with the previous version.
- Whether the action is related to other actions with individually insignificant but cumulatively significant impacts. Significance exists if it is reasonable to anticipate a cumulatively significant impact on the environment. Significance cannot be avoided by terming an action temporary or by breaking it down into small component parts.
100
Aquaculture represents a substantial impact to eelgrass based simply on the acreages involved. While impacts are temporary if it is assumed all aquaculture activities cease with the expiration of the 2017 NWP 48, the likely reissuance of the permit and nearly certain continuation of aquaculture beyond the permit expiration date guarantee these impacts, temporary or not, will continue well in to the future. This is further discussed below.
- The degree to which the action may adversely affect districts, sites, highways, structures, or objects listed in or eligible for listing in the National Register of Historic Places or may cause loss or destruction of significant scientific, cultural, or historical resources.
No impacts to these resources is anticipated.
- The degree to which the action may adversely affect an endangered or threatened species or its habitat that has been determined to be critical under the Endangered Species Act of 1973.
The proposed action is likely to adversely affect designated critical habitat for several species listed under the ESA including Puget Sound Chinook salmon, Hood Canal summer run chum salmon, and Puget Sound steelhead. Adverse effects are due in part to impacts on eelgrass (NMFS 2015). Recent programmatic ESA consultation concluded terms and conditions were required to protect eelgrass from aquaculture.
- Whether the action threatens a violation of Federal, State, or local law or requirements imposed for the protection of the environment.
The action does threaten a violation of State requirements under the Shoreline Management Act to achieve no net loss of eelgrass and Federal requirements to protect eelgrass imposed under the ESA for aquaculture activities. The proposed action is not consistent with either of these requirements.
Significance threshold
The cumulative impacts of past and present activities on eelgrass on an acreage basis is unknown. What is known is that eelgrass has been lost in Puget Sound. Also known is that native eelgrass is under threat in all three regions by various stressors. In Willapa Bay and Grays Harbor this is principally from invasion of non-native eelgrass, which is believed to provide many of the functions of native eelgrass, potential changes in the water temperature and sea level from climate change, and from aquaculture. In Puget Sound the list of stressors includes those just listed and also water quality and habitat changes from urbanization and development which manifest themselves in a number of ways (degraded water quality, overwater structures, mooring anchors, boat traffic).
Estimates exist for the current distribution of the species in each region. Recent trends only exist for Puget Sound and while these trends are subsamples of the total population, they are considered to reflect the status of the population as a whole. The recent trend indicates eelgrass areas have been stable. On a smaller scale, eelgrass trends are variable with some areas showing declines and others increases. The eelgrass estimates from Willapa Bay and Grays Harbor cannot be meaningfully used to examine trends because of the different methodologies used.
The determination of a significance threshold, a threshold that if reached is indicative of significant effects, is desirable in cumulative effects analysis (CEQ 1997). In the State of Washington it is evident based on the establishment of a ‘no net loss’ requirement for eelgrass that a threshold of significance has already been established in this region and that it has been reached. This is supported by WDFW (2010) which stated the following regarding eelgrass status, “The broad patterns of development and shoreline modification around the Puget Sound basin have caused small, incremental effects that have
101
become cumulatively significant”. In Puget Sound this is further supported by 1) the designation of eelgrass as critical habitat for multiple endangered species, and 2) the establishment of a goal to increase eelgrass by 20% for Puget Sound ecosystem recovery generally. Additional losses beyond this threshold would therefore be considered significant. The loss and/or degradation of potentially 1,000s of acres of eelgrass in Puget Sound alone, which is anticipated to occur under the proposed action, would thus be considered a significant cumulative impact under NEPA. There is more uncertainty with respect to losses in Willapa Bay and Grays Harbor. While the state requirement extends to these two embayments, there is substantially more eelgrass present as a percentage of estuary area, and it is possible eelgrass populations in these embayments have not experienced declines relative to historical populations. There are Federal protections including designation of eelgrass as EFH and an HAPC under the MSA and the general CWA protection of eelgrass as a special aquatic site. Given this background, it is likely that eelgrass populations in Grays Harbor and Willapa Bay can sustain losses without triggering a significance threshold. However, the loss and/or degradation of potentially 1,000s of acres of eelgrass in Willapa Bay and Grays Harbor is considerable and is likely to have ramifications for many additional species in these areas. These losses combined with the State and Federal protections, and the NEPA regulations which specifically states that significance cannot be avoid by breaking down the action into smaller parts (40 CFR 1508.27 (b)(7)), these impacts would also be considered significant.
The 2013 estimated eelgrass area is 55,870 acres in Puget Sound. The proposed action is anticipated to degrade or remove over 4,000 acres which represents 7% of this total. Over 2,600 of these acres are undisturbed by aquaculture on fallow lands. This is a large magnitude impact that is certain to occur. The magnitude of future impacts from development and climate change are unknown and less certain. In some cases the eelgrass will be replaced with oysters which provide comparable levels of productivity and function for some species such as salmon and Dungeness crab. For some species, such as herring, important functions of the habitat (i.e., spawning substrate) will be lost. In other cases, eelgrass habitat would be replaced with cover nets which provide relatively low habitat value compared to the eelgrass. Furthermore the benefits provided by oyster habitat are ephemeral because of the disturbance cycle associated with aquaculture. The eelgrass populations also decline seasonally so this may be comparable to disturbances from oyster aquaculture. The timing of aquaculture impacts are not seasonal but occur year around.
Impacts to eelgrass from aquaculture are on their surface temporary because the underlying habitat conditions (substrate, elevation, and water quality) remain the same allowing eelgrass to recover once the disturbance is removed. However, the regular disturbance associated with aquaculture both under the 2017 NWP 48 and under future permits results in a condition where eelgrass rarely recovers to its predisturbance condition. Even if full recovery is achieved, there is a substantial period of time where temporary losses of eelgrass will occur for periods of years. This temporary impact will undoubtedly have adverse effects on the species that depend on eelgrass habitat such as Dungeness crab, herring, and salmon. Loss of several years of eelgrass function at the mouth of a salmon stream for example will reduce the available rearing habitat for this species and result in fewer of that species surviving to adulthood. This would affect several year classes of that species and any fisheries on that species. In cases where the species is listed under the ESA, decreased survival of several year classes may have long term ramifications for the recovery of that species. NEPA defines significant effects as being both short- and long-term (40 CFR 1508.27(a)). The fact that effects may be temporary does not by itself exclude them from a determination of significance.
102
Given the magnitude of the impacts in acreage, the importance of eelgrass to the marine ecosystem, and the scale of the aquaculture impacts relative to other stressors, the impacts are considered significant.
4.3. Pacific sand lance and surf smelt
These species are analyzed together due to their similar life history and the similar list of stressors to the species.
The Pacific sand lance, is found from southern California around the north Pacific Ocean to the Sea of Japan, and across Arctic Canada. It is generally acknowledged to be of great ecological importance in local marine food webs (Bargmann 1998). The relative abundance of Puget Sound surf smelt, sand lance are unknown (Pentilla 2007). Greene et al. (2015) found evidence that suggested surf smelt populations in the south and central Puget Sound area have declined up to 100 fold in the last 40 years while sand lance populations have increased throughout all areas of Puget Sound during that same timeframe.
The following summaries of surf smelt and sand lance biology is from Pentilla (2007):
The surf smelt is a common and widespread nearshore forage fish throughout Washington marine waters. Spawning activity occurs in a wide variety of wave-exposure regimes, from very sheltered beaches in southernmost Puget Sound and Hood Canal to fully-exposed pebble beaches on the outer coast of the Olympic Peninsula. Spawning activity is distributed throughout the Puget Sound Basin, and stock boundaries cannot be defined geographically. Currently, about 10 percent of the shoreline of the Puget Sound Basin is documented to be surf smelt spawning habitat. Spawning regions are commonly occupied during the summer (May-August), fall-winter (September-March), or yearround (spawning every month, perhaps with a seasonal peak).
The life history of the surf smelt is intimately linked to nearshore geophysical processes. The critical element of surf smelt spawning habitat is the availability of a suitable amount of appropriately textured spawning substrate at a certain tidal elevation along the shoreline. Their potential spawning/spawn incubation zone spans the uppermost onethird of the tidal range, from approximately +7 feet up to extreme high water in central Puget Sound or the local equivalent. Spawning substrate grain size is generally a sand-gravel mix, with the bulk of the material in the 1-7 mm diameter range (Schaefer 1936, Penttila 1978).
WDFW surveys have documented surf smelt spawning habitat along 195 lineal statute miles in Puget Sound (Bargmann 1998). Their life history is unknown. There is no evidence of widespread migrations to and from the outer coast.
Sand lance, colloquially referred to as candlefish by local anglers, are also a common and widespread forage fish of the nearshore marine waters of Washington, including all of the greater Puget Sound Basin. Very little species-specific biological data are available (Field 1988). Sand lance spawning habitat has been documented in the Puget Sound Basin only since late 1989, when a protocol for detecting eggs in suitable substrate was developed (Penttila 1995a, b). Currently, about 10 percent of the basin’s shoreline has been documented as sand lance spawning habitat (Figure 6). Additional sand lance spawning beaches continue to be found during ongoing habitat survey projects (WDFW unpub. data). In
103
many instances, the spawning beaches of fall-winter surf smelt and sand lance populations overlap geographically.
Although the species are taxonomically unrelated, the spawning habitat of the Pacific sand lance generally resembles that of the surf smelt: upper intertidal beaches consisting of sand and gravel (Penttila 1995b). Their spawning sites are also similarly scattered evenly over the landscape of the Puget Sound Basin, to such a degree that hypothetical geographical stock boundaries are not apparent. Cooccurrence of eggs of the two species in the substrates is common during the winter, when the spawning seasons of Puget Sound sand lance and winter-spawning surf smelt populations overlap. The eggs of both species can be found incubating in the same substrate at the same time (Penttila 1995b). Sand lance spawning habitat attributes derive from physical forces acting on sediment in the upper third of the intertidal zone, generally between mean higher high water (MHHW) and about +5 feet in tidal elevation in central Puget Sound or local equivalent. The grain-size spectrum of typical sand lance spawning substrate can be characterized as sand, finer-grained than that of surf smelt, with the bulk of the material in the range of .2-.4 mm in diameter (Penttila 1995b; WDFW unpub. data).
Bargmann 1998: The actual spawning habitat of the Pacific sand lance was virtually unknown prior to the discovery of their spawn deposits in the upper intertidal zone of Port Gamble Bay in 1989. Systematic surveys have documented sand lance spawning habitat on 129 lineal statute miles of Puget Sound shoreline (Pentilla 1995a, 1995b, 1997). The sand lance spawning habitat survey was estimated to be about 75% complete for the Puget Sound basin prior to being reduced by budget reductions in 1997. Sand lance spawning populations on Washington’s outer coast and coastal estuaries have not been surveyed, although the occurrence of yolk sac sand lance larvae in those areas in the winter months indicates their presence.
Status
Washington State has protections in place for forage fish species as discussed below.
- The language of Washington Administrative Code (WAC) 220-110, the Hydraulic Code Rules governing hydraulic permit approvals by the WDFW, lists herring, surf smelt and sand lance spawning habitats as “marine habitats of special concern.” A “no net loss” approach is applied to these habitats.
- The WDFW Hydraulic Code Rules stipulate that the construction of bulkheads and other bank protection must not result in a permanent loss of forage fish spawning beds (WAC 220-110280(4)).
- Permissible in-water development activities are also subject to seasonal work-closure periods during local forage fish spawning seasons (WAC 220-110-271(1)). WDFW hydraulic permits granted for in-water development actions may stipulate certain measures to mitigate unavoidable forage fish habitat losses and address interruptions to beach sediment sources and movements (Pentilla 2007).
- Grounding of floats and rafts is prohibited on surf smelt, Pacific herring, and sand lance spawning beds by WDF per WAC 220-110-300 (1).
104
- The state Growth Management Act includes herring and surf smelt spawning areas as examples of priority fish and wildlife habitat conservation “critical areas”, for which there is an expectation of mapping and protective designations. This species group’s ecological importance and critical habitat vulnerability have led to their inclusion in the species and habitat lists of the WDFW’s Priority Habitats and Species Program.
- The PSP has identified a goal to remove more shoreline armoring in Puget Sound than is constructed between 2011 and 2020.
Similar to the discussion above for eelgrass, SMP guidelines under the Shoreline Management Act contain protections for forage species including sand lance and surf smelt:
- WAC 172-32-186(8) directs SMPs to “include policies and regulations designed to achieve no net loss of those ecological functions”. WDOE (2010) indicates that “the no net loss standard is designed to halt the introduction of new impacts to shoreline ecological functions resulting from new development. Both protection and restoration are needed to achieve no net loss.”
- Protecting critical saltwater habitats is important to achieving no net loss of ecological functions. The SMP Guidelines state, “Critical saltwater habitats require a higher level of protection due to the important ecological functions they provide” [WAC 173-26-221(2)(c)(iii)(A)]. Critical saltwater habitats include “…all kelp beds, eelgrass beds, spawning and holding areas for forage fish, such as herring, smelt and sandlance; subsistence, commercial and recreational shellfish beds; mudflats, intertidal habitats with vascular plants, and areas with which priority species have a primary association” (WAC 173-26-221(2)(c)(iii)(A)).
- The shoreline vegetation conservation section [WAC 173-26-221(5)] defines vegetation conservation as “activities to protect and restore vegetation along or near marine and freshwater shorelines that contribute to the ecological functions of shoreline areas.” These activities include “the prevention or restriction of plant clearing and earth grading, vegetation restoration, and the control of invasive weeds and nonnative species (WDOE 2011).
The SMP guidelines (WDOE 2015) include specific provisions for aquaculture including:
- Forage fish spawning habitat (Figure 16-5) is a critical saltwater habitat requiring protection. All aquaculture should be sited outside known forage fish (such as Pacific herring and sand lance) spawning habitat, if possible. If not possible, operating during certain work windows and conducting surveys and monitoring for forage fish activity can be used to avoid and mitigate impacts.
- SMPs should require forage fish spawning baseline surveys for new intertidal aquaculture that will occur at or near documented forage fish spawning habitat. The surveys should be conducted by trained personnel using appropriate protocols approved by WDFW. Other aquaculture permits may require a survey and Ecology recommends that proponents be allowed to submit these to meet local requirements.
- Ecology recommends that shellfish culturing be restricted to below the +5 feet Mean Lower Low Water tidal elevation if the area is documented as Pacific sand lance spawning habitat by WDFW or a site specific survey. Also, shellfish culturing should be restricted to below the +7 feet Mean
105
Lower Low Water tidal elevation if the area is documented surf smelt spawning habitat by WDFW or a site specific survey.
4.3.1. Past and present effects
Shoreline armoring
Shoreline modifications and development often negatively affect spawning sites of forage fish. A significant proportion of productive forage fish spawning habitat probably was lost in the Puget Sound basin prior to 1973 when shoreline armoring was largely unregulated (Pentilla 2007). Shoreline armoring and pollution were suggested as reasons for declining smelt population in Puget Sound by Greene et al. (2015).
Williams and Thom (2001) reviewed the potential impacts of various forms of shoreline armoring on nearshore environmental factors and resources in the Puget Sound region. Shoreline armoring may be the primary threat to surf smelt and sand lance spawning habitat (Thom et al. 1994). Armoring affects spawning habitat by physical burial of the upper intertidal zone during the course of creating or protecting human infrastructure and activities. Armoring alters the grain size making it potentially unsuitable for forage fish spawning (Dethier et al. 2016).
The sheltered bays of the inland waters so important to spawning forage fish have also been the shorelines of highest interest for commercial and residential development. Armoring also blocks, delays or eliminates the natural erosion of material onto the beach and its subsequent transport (Johannessen and MacLennan 2007). These processes maintain forage fish spawning substrate on the upper beach (Williams and Thom 2001). Although beaches may appear to be stable, their sediment is in constant motion, driven by prevailing wind and waves. The sand and gravel making up forage fish spawning substrate moves along the shoreline and eventually off into deep water, and must be replaced by new material entering the shoreline sediment transport system. A lack of a constant supply of new sand and gravel, primarily derived from eroding shoreline bluffs, may lead to coarsening, lowering of the beach elevation, and thus longterm degradation of spawning habitat.
Results of the PSNERP Change Analysis indicate that shoreline armoring occurred along 27 percent of Puget Sound (Myers 2010). The percent of armored shoreline varied considerably (9.8–62.8 percent) depending on the sub-basin. The different types of shoreline armoring and density are illustrated in Figure 4-12. Relevant to surf smelt and sand lance spawning, 27% of barrier beaches and 33% of bluff backed beaches were armored or 392 out of 1,224 miles (Myers 2010).
106
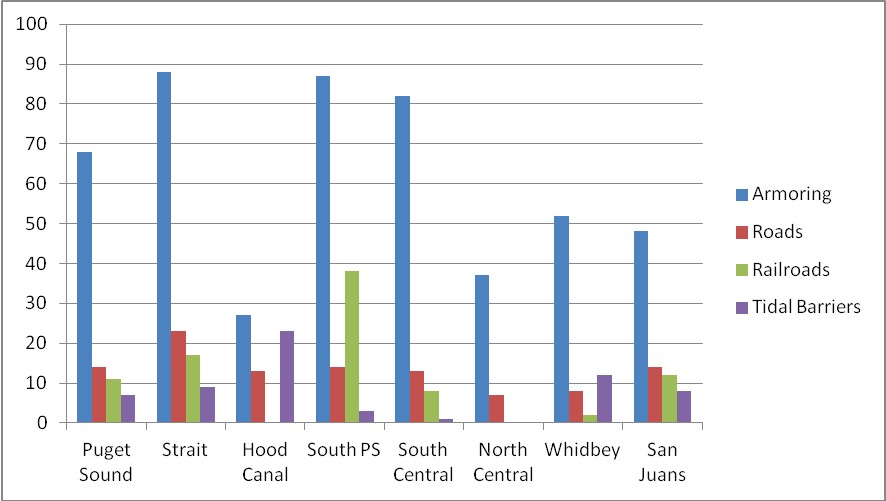
Figure 4-12. Presence of different stressors along mapped fill shoreline for Puget Sound and subbasins, expressed as a percentage (%) of fill length that stressors occupied (for example, Armoring was present along 68 percent of filled shoreline length in Puget Sound as a whole) (Strait, Strait of Juan de Fuca; PS, Puget Sound; Whidbey, Whidbey Basin) (from Myers 2010).
Recent data from Hydraulic Project Approvals (permits issued for in-water work and shoreline construction activities) indicate more armoring was gained than lost cumulatively since 2011, resulting in a net cumulative length of 1.1 miles (6,000 feet). However, in 2014, more armoring was removed than was added, a ratio that aligns well with the 2020 PSP target of no net change in armoring relative to the baseline year of 2011 (Hamel et al. 2015).
Overwater structures
Nightingale and Simenstad (2001) reviewed the potential impacts of various forms of overwater structure (e.g., docks, ramps, floats, boathouses) on nearshore environmental factors and biological resources in the Puget Sound region. The impacts on forage fishes and their critical habitats vary with the species and the size and configuration of the structure. Surf smelt and sand lance spawning habitats may persist beneath overwater structures if the structures span the spawning habitat zone, and pilings have minimal displacement of beach area, so that upper intertidal sediment distribution and movement are not affected (WDFW unpub. Data, in Pentilla 2007).
Marine Riparian Vegetation
A significant attribute of surf smelt spawning habitat may be the overhead shading provided by the canopies of mature trees rooted in the backshore zone bordering the spawning beaches. Studies have strongly suggested that the presence of shading terrestrial vegetation in the marine riparian corridor has
107
a positive effect on the survival of surf smelt spawn incubating in sand-gravel beaches in the upper intertidal zone during the summer months within the Puget Sound Basin (Penttila 2002).
Fishing
Surf smelt are recreationally and commercially important harvests for human consumption at scattered locations throughout the Puget Sound Basin. Commercial and recreational Surf Smelt fisheries each estimated at 100,000 pounds annually. The population size in Puget Sound is unknown.
Pacific sand lance have never been harvested commercially in the Puget Sound Basin, and commercial exploitation of the species has recently been banned by the Washington Department of Fish and Wildlife (WDFW), given their important ecological role. Incidental catches of sand lances are dip-netted from “bird-balls” or “bait balls” by recreational anglers during local salmon fishing seasons as a preferred sport-bait for Chinook salmon (Pentilla 2007).
4.3.2. Effects of the proposed action
The effects of the proposed action are discussed above in Section 3. They include removing spawning habitat by placement of nets, floats, barges, or other structures on spawning beaches, smothering eggs by trampling by foot or vehicle or grounding of vessels on beaches, and direct mortality of adults due to capture in aquaculture cover nets. There are no timing restrictions or monitoring associated with the proposed action that could minimize these effects.
Surf smelt and sand lance would be particularly vulnerable to cover nets installed along the shorelines because of their spawning behavior. If not dissuaded from spawning by the nets, they could be captured and killed by the nets. If they are persuaded from spawning, this habitat no longer provides the spawning function for these species.
There are currently an estimated 1,162 aquaculture acres collocated with mapped smelt and 416 acres collocated with mapped sand lance spawning habitat. GIS analysis indicates that aquaculture project areas collocated with spawning habitat extend waterward from the shoreline about 150-600 ft. Conservatively assuming each aquaculture project area extends out 400 ft waterward of the shoreline results in an estimated 109 ft of lineal shoreline per acre. This translates to totals of 24 miles (126,658 lineal ft) of surf smelt and 9 miles (45,344 lineal ft) of sand lance spawning habitat affected by aquaculture. Note this does not account for impacts that may occur to adult fish migrating along the shoreline to spawning areas that may encounter nets outside of the spawning area.
4.3.3. Effects of future actions
Development
Urbanization and development are expected continue in Puget Sound as discussed above. This results in continued shoreline armoring, overwater structures, and loss of marine vegetation.
New armoring continues to be constructed at an average pace of 0.7 miles (3,700 feet) per year (mean of 2011 – 2014), but the pace has slowed progressively since 2012. In contrast, shoreline armoring is removed at an average rate of 0.4 miles (2,200 feet) per year (Hamel et al. 2015).
Recent Corps permitting for overwater structures is illustrated in Figure 4-6.
108
State regulation administered under SMPs may minimize these effects to some degree but this is uncertain.
Aquaculture
Similar to the above discussion for eelgrass, aquaculture is certain to continue beyond the expiration of the 2017 NWP 48. The impacts described for the proposed action would thus continue into the future and likely increase as additional area is put into aquaculture production.
Fishing
Fishing for surf smelt is expected to continue.
Climate Change
Urban communities are likely to respond to sea level rise with an increase in armoring to delay the natural erosion of shorelines. This response will “squeeze” forage fish spawning beaches between rising water levels and armoring structures. USGS researchers are using models to understand the effects the “squeeze” will have on fish that rely on beaches for their survival (Liedtke 2012).
4.3.4. Summary and conclusion
The cumulative impacts on eelgrass are summarized in Table 4-7. Table 4-7. Summary of Cumulative Effects on Pacific herring
|
stressor |
Puget Sound |
Willapa Bay |
Grays Harbor |
|
Shoreline armoring |
Likely caused the greatest historical impact; shoreline armoring expected to continue, new state regulations may limit to impacts to some degree |
Limited in extent; limited future armoring |
Concentrated in certain areas; limited future armoring |
|
Overwater structures |
numerous and increasing; |
overwater structures limited to a few areas; |
overwater structures limited to few developed locations |
|
Aquaculture |
Historical impacts likely; currently an estimated 1,162 aquaculture acres collocated with mapped smelt and 416 acres collocated with mapped sand lance spawning habitat; present impacts will continue into the future |
Unknown historical impacts; no mapped spawning habitat currently |
Unknown historical impacts; very limited spawning habitat currently that is not collocated with aquaculture |
|
Fishing/ overfishing |
200,000 lbs surf smelt harvested annually; uncertain effects on population |
No known effects |
No known effects |
109
|
Climate change |
Sea level rise is may eliminate forage fish spawning habitat as beaches become compressed against the shore |
Significance
Context
A determination of significance requires consideration of both context and intensity (40 CFR 1508.27(a)). Context means that the significance of an action must be analyzed in several contexts such as society as a whole (human, national), the affected region, the affected interests, and the locality.
Surf smelt and sand lance are both broadly distributed in Washington’s marine waters but very limited is known about their life history. Their population size and structure is unknown but there is concern they are declining, at least in Puget Sound, in part due to losses of spawning habitat. Very limited study suggests surf smelt may have declined in Puget Sound, perhaps dramatically, while sand lance populations may have increased. There is virtually no information on these species in Grays Harbor and Willapa Bay. These species play an important role in the marine food web as highly nutritious prey for many predators including species listed under the ESA such as marbled murrelet and salmon species. Regionally spawning habitat is protected by the State of Washington affords some protection to spawning habitat under the Shoreline Management Act and HPA regulations.
The primary impact to these species both historically and presently is considered to be loss of beach spawning habitat due to shoreline armoring. Other activities and structures that are occur along the nearshore beach habitat such as docks and piers and aquaculture are also likely to have some impact. These impacts are expected to continue into the future. Sea level rise associated with climate change may exacerbate these impacts.
There are a number of affected interests including shellfish growers, fishing interests, salmon recovery interests, tribal communities, NGO’s, natural resource agencies, and development interests. Development and aquaculture interests generally are competing with resource agency interests over habitat protections.
Intensity
The following factors should be considered when evaluating intensity (40 CFR 1508.27). These factors are discussed in the context of cumulative impacts.
- Impacts that may be both beneficial and adverse. A significant effect may exist even if the Federal agency believes that on balance the effect will be beneficial.
Limited beneficial impacts have occurred in the form of bulkhead removal and beach restoration in Puget Sound.
- The degree to which the proposed action affects public health or safety.
No public health or safety issues are identified. Shoreline armoring provides certain protections for personal property.
- Unique characteristics of the geographic area such as proximity to historic or cultural resources, park lands, prime farmlands, wetlands, wild and scenic rivers, or ecologically critical areas.
110
Forage fish spawning habitat is identified as an ecologically critical area.
- The degree to which the effects on the quality of the human environment are likely to be highly controversial.
Impacts to forage fish spawning habitat from various impacts including development activities and aquaculture have generated much recent concern as evidenced by regulations promulgated by the state for their protection.
- The degree to which the possible effects on the human environment are highly uncertain or involve unique or unknown risks.
There is high uncertainty with respect to impacts on forage fish due simply to the very limited current understanding of the ecology and population of the species.
- The degree to which the action may establish a precedent for future actions with significant effects or represents a decision in principle about a future consideration.
It is uncertain whether the proposed action will set precedent for future actions; however, there is strong potential for this to occur. The 2017 NWP 48 has been issued twice previously and is likely to be issued again in 2022. Each iteration of the permit has been updated based on experiences with the previous version.
- Whether the action is related to other actions with individually insignificant but cumulatively significant impacts. Significance exists if it is reasonable to anticipate a cumulatively significant impact on the environment. Significance cannot be avoided by terming an action temporary or by breaking it down into small component parts.
Aquaculture and the other identified stressors represents a largely unknown impact to forage fish. These stressors do represent known impacts to habitat that is an important part of the species life history. The cumulative impacts to this habitat are substantial at present and they are expected to increase in the future. This is further discussed below.
- The degree to which the action may adversely affect districts, sites, highways, structures, or objects listed in or eligible for listing in the National Register of Historic Places or may cause loss or destruction of significant scientific, cultural, or historical resources.
No impacts to these resources is anticipated.
- The degree to which the action may adversely affect an endangered or threatened species or its habitat that has been determined to be critical under the Endangered Species Act of 1973.
The proposed action is likely to adversely affect designated critical habitat for several species listed under the ESA including Puget Sound Chinook salmon, Hood Canal summer run chum salmon, and Puget Sound steelhead. Adverse effects are due in part to impacts on eelgrass (NMFS 2015). Recent programmatic ESA consultation concluded terms and conditions were required to protect eelgrass from aquaculture.
- Whether the action threatens a violation of Federal, State, or local law or requirements imposed for the protection of the environment.
The proposed action is inconsistent with State requirements under the SMA to protect forage fish spawning habitat. The development related stressors would also be inconsistent with these requirements, although there are competing SMA requirements related to property safety that are relevant to shoreline armoring projects.
Significance threshold
The cumulative impacts of past and present activities on surf smelt and sand lance are unknown due to the lack of any population data. The determination of a significance threshold relevant to the species
111
itself is therefore not possible. Knowledge is limited to known impacts to the species spawning habitat but even here there is a fair amount of uncertainty. The geographic locations of spawning habitat are not entirely known with even less known about the species activities in Willapa Bay and Grays Harbor.
Despite this a significance threshold can be established for the known spawning habitat for the 75% of Puget Sound that has been inventoried. The State of Washington has determined that a ‘no net loss’ policy is justified for forage fish spawning habitat. The PSP has further identified a goal of removing more shoreline armoring than is placed. These actions the contention that the significance threshold has already been reached from the cumulative impacts that have occurred to date meaning that any additional impacts would be considered significant.
Currently there are 195 mapped miles of surf smelt and 129 mapped miles of sand lance spawning habitat in Puget Sound. Shoreline armoring in Puget Sound occurs on 392 out of the 1,124 miles of the beach type habitat used for spawning by these species in Puget Sound. There is substantial overlap between the mapped spawning habitat and armoring.
Aquaculture in Puget Sound affects an estimated 24 miles or 12% of the total surf smelt spawning habitat and 9 miles or 7% of the total sand lance spawning habitat. These are certainly not insignificant percentages. Coupled with likely direct mortality of adults associated with the extensive placement of cover nets throughout Puget Sound (potentially 6,000 acres), the potential for significant effects certainly exists. However, the degree to which aquaculture activities are actually collocated with spawning habitat is unknown because the culture activities typically occur lower on the beach than spawning. The exception is clam culture above the +5 ft MLLW spawning zone for sand lance. The degree to which this exception occurs is unknown. In many cases aquaculture operations could be conducted with negligible impacts on forage fish spawning that occurs on beaches immediately upslope of the culture. These farms would rarely if ever conduct activities in the upper slopes of the adjacent beach where spawning occurs. On the other hand, it is just as likely that many operations would conduct substantial activities in these upslope areas including driving vehicles, storing materials, and even culturing itself (as discussed previously in the case of sand lance). In these cases, substantial harm to spawning fish can occur or spawning areas could be removed from use by the population. The issue is really about individual husbandry practices of which there is a wide range. It is unknown if one the scenarios described above predominates. May be more important is the fact that there are no restrictions in this regard for the proposed action. It must therefore be assumed that these types of impacts will occur. The conservative approach would assume common occurrence. Given the potential for significant impacts due simply to the large acreages involved and the fact any impacts will continue well into the future, it is prudent to default to the consensus of the state scientific experts who have determined that an important threshold of cumulative effects has already been reached as described above. The conclusion therefore is that significant cumulative effects to surf smelt and sand lance spawning habitat would occur due to the proposed action.
112
5. References
Aitkin, J. K. 1998. The Importance of Estuarine Habitats to Anadromous Salmonids of the Pacific Northwest: A Literature Review. Western Washington Office, US Fish and Wildlife Service, Aquatic Resources Division. Lacey, WA.
Alcock, T. Z. and K. Bennett. 2005. Willapa Bay estuarine ranking – Preliminary geospatial data inventory. University of Washington, Olympic Natural Resources Center, Forks, WA. 31 pp.
Banas, NS, B.M. Hickey, P. Maccready, J.A. Newton. 2004. Dynamics of Willapa Bay, Washington: A Highly Unsteady, Partially Mixed Estuary, American Meteorological Society.
Banas, N.S., B.M. Hickey, J.A. Newton, J.L. Ruesink. 2005. Tidal exchange, bivalve grazing, and patterns of primary production in Willapa Bay Washington, USA. Submitted to Mar. Ecol. Prog. Ser.
Bargmann, G. 1998. Forage fish management plan. Washington Dept. of Fish and Wildlife 66 pp.
Adopted by the Washington Fish and Wildlife Commission on January 24, 1998
Blake, B and P Zu Ermgassen. 2015. The History and Decline Of Ostrea Lurida In Willapa Bay,
Washington. Journal of Shellfish Research, Vol. 34, No. 2, 273–280, 2015
Carman, R, K Taylor, and P Skowlund. 2010. Regulating Shoreline Armoring in Puget Sound, in Shipman, H., Dethier, M.N., Gelfenbaum, G., Fresh, K.L., and Dinicola, R.S., eds., 2010, Puget Sound
Shorelines and the Impacts of Armoring—Proceedings of a State of the Science Workshop, May
2009: U.S. Geological Survey Scientific Investigations Report 2010–5254, p. 11-18
Costanza, R., d’Arge, R., de Groot, R., Farber, S., Grasso, M, Hannon, B., Limburg, K., Naeem, S., O’Neill, R.V.O., Paruelo, J., Raskin, R.G., Sutton, P., and M. van den Belt. 1997. The value of the world’s ecosystem services and natural capital. Nature 387: 253-260.
Davis, W and AG Murphy. 2015. Plastic in surface waters of the Inside Passage and beaches of the Salish
Sea in Washington State. Marine Pollution Bulletin 97 (2015) 169–177
Department of the Interior, U.S. Fish and Wildlife Service, Willapa National Wildlife Refuge. 1997.
Environmental Assessment. Control of Smooth Cordgrass (Spartina Alterniflora) On Willapa
National Wildlife Refuge, Willapa Bay, Pacific County, Washington. May 1997
Dethier M, W. Raymond, A. McBride, J Toft, J Cordell, A Ogston, S Heerhartz, H Berry. 2016. Multiscale impacts of armoring on Salish Sea shorelines: Evidence for cumulative and threshold effects. Estuarine, Coastal and Shelf Science 175 (2016) 106-117
Dumbauld, B. R. and S. W. Echeverria. 2003. The influence of burrowing thalasiinid shrimp on the distribution of intertidal seagrasses in Willapa Bay, Washington. Aquat. Bot. 77:27-42.
Dumbauld, B.. J. Ruesink, K. Holsman, G. Hosack, B. Semmens, H. Tallis, H. Li, D. Armstrong, S. Rumrill, V. Poulton, D. Cheney, S. Harbell, and B. Dewey. 2004. The ecological role and potential impacts of molluscan shellfish culture in the estuarine environment. Termination Report to the Western Regional Aquaculture Center (WRAC). Reporting period: April 1st 2003-March 31st 2004. 31 pp.
EPA. 2016. Compensatory Mitigation Factsheet. https://www.epa.gov/sites/production/files/201508/documents/compensatory_mitigation_factsheet.pdf. Accessed 1-19-2016
113
EPA and Corps. 1990. Memorandum of Agreement Between The Department of the Army and The Environmental Protection Agency. The Determination Of Mitigation Under The Clean Water Act Section 404(B)(1) Guidelines
Gaeckle, J. 2016. Extent and Magnitude of Nutrient and Contaminant Concentrations in Eelgrass (Zostera marina L.) in Puget Sound. March 30, 2016. Nearshore Habitat Program, Aquatic Resources Division, Washington State Department of Natural Resources
Gaeckle, J, Lisa Ferrier and K Sherman. 2015. Spatial Evaluation of the Proximity of Outfalls and Eelgrass
(Zostera marina L.) in Greater Puget Sound. February 2015. Nearshore Habitat Program, Aquatic Resources Division, Washington State Department of Natural Resources. February 2015
Gaeckle, J. 2012. Effects of Outfalls and Effluent on Eelgrass (Zostera marina L.) Nearshore Habitat Program, Aquatic Resources Division, Washington State Department of Natural Resources. August 17, 2012
Greene, C, L Kuehne, C Rice, K Fresh, and D Penttila. 2015. Forty years of change in forage fish and jellyfish abundance across greater Puget Sound, Washington (USA): anthropogenic and climate associations. Mar Ecol Prog Ser. Vol. 525: 153–170
Hamel, N., J. Joyce, M. Fohn, A. James, J. Toft, A. Lawver, S. Redman and M. Naughton (Eds). 2015. 2015 State of the Sound: Report on the Puget Sound Vital Signs. November 2015. 86 pp. www.psp.wa.gov/sos.
Harrison, P. G. and R. E. Bigley. 1982. The recent introduction of the seagrass Zostera japonica Aschers. & Graebn. to the Pacific coast of North America. Canadian Journal of Fisheries and Aquatic Sciences 39:1642-1648.
Hallock, D., 2008. River and Stream Water Quality Monitoring Report, Water Year 2008. Washington State Department of Ecology, Olympia, WA.
Hickey, B.M. and N. Banas. 2003. Oceanography of the U.S. Pacific Northwest Coastal Ocean and Estuaries with Application to Coastal Ecology, Estuaries Vol. 26, No. 4B, p. 1010–1031
Hoquiam and Washington State Department of Ecology. 2016. Westway Expansion Project. Final Environmental Impact Statement. September. Hoquiam and Lacey, WA.
Jones and Stokes Associates, Anchor Environmental, L.L.C. and R2 Resource Consultants. 2006. Overwater Structures And Non-Structural Piling White Paper. Prepared for Washington Department of Fish and Wildlife
Krembs, C., Julia Bos, Skip Albertson, Mya Keyzers, Laura Friedenberg, Julianne Ruffner, Dr. Brandon Sackmann, Carol Maloy. 2012. POSTER: South Puget Sound 2011 and 2012 in review: Aerial and water column observations from Ecology’s long-term monitoring program. November 2012. Publication No. 12-03-052.
Krembs, C, M Dutch, V Partridge, S Weakland, J Bos, S Albertson, B Sackmann, M Keyzers, L Friedenberg, C Falkenhayn Maloy. 2014. POSTER: Changes in nutrient ratios drive changes in pelagic and benthic assemblages, and benthic-pelagic coupling in Puget Sound: A compelling hypothesis linking water quality and the benthos. Environmental Assessment Program, Washington State
114
Department of Ecology, 300 Desmond Dr., Lacey, Washington, 98504, USA. 2014. Publication No. 14-03-024. June 2014
Liedtke, T.L., 2012, Western Fisheries Research Center—Forage fish studies in Puget Sound: U.S. Geological Survey Fact Sheet 2012-3023, 2 p.
Lichvar, R.W., D.L. Banks, W.N. Kirchner, and N.C. Melvin. 2016. State of Washington 2016 Wetland Plant List. The National Wetland Plant List: 2016 wetland ratings. Phytoneuron 2016-30: 1-17. Published 28 April 2016. ISSN 2153 733X
Lönnstedt, O. and P. Eklöv. 2016. Environmentally relevant concentrations of microplastic particles influence larval fish ecology. 3 June 2016, Science 352: 1213-1216
Mach, ME, S Wyllie-Echeverria, and J Rhode Ward. 2010. Distribution and potential effects of a nonnative seagrass in Washington State Zostera japonica Workshop September 23 – 24, 2010 Friday Harbor Laboratories San Juan Island, Washington. Report for Washington State Department of Natural Resources and Washington Sea Grant.
Mohamedali, T., M. Roberts, B. Sackmann, and A. Kolosseus. 2011. Puget Sound Dissolved Oxygen
Model Nutrient Load Summary for 1999-2008. Washington State Department of Ecology, Olympia, Washington
Myers D. 2010. Shoreline Development on Puget Sound, in Shipman, H., Dethier, M.N., Gelfenbaum, G.,
Fresh, K.L., and Dinicola, R.S., eds., 2010, Puget Sound Shorelines and the Impacts of Armoring—
Proceedings of a State of the Science Workshop, May 2009: U.S. Geological Survey Scientific Investigations Report 2010–5254, p. 11-18
Nightingale, B. and C. Simenstad. 2001b. White Paper. Marine Overwater Structures: Marine Issues. University of Washington . Seattle, WA. Prepared for Washington Department of Fish and
Wildlife, Washington Department of Ecology, and Washington Department of Transportation.
PSP (Puget Sound Partnership) 2016. Comprehensive Plan . The 2016 Action Agenda for Puget Sound. Puget Sound Partnership. June 2016. 68 pp.
Roberts, M, T Mohamedali, B Sackmann, T Khangaonkar and Wen Long. 2014. Puget Sound and the Straits Dissolved Oxygen Assessment. Impacts of Current and Future Nitrogen Sources and
Climate Change through 2070. Washington State Department of Ecology Publication No. 14-03007
Simenstad, C.A., M. Ramirez, J. Burke, M. Logsdon, H. Shipman, C. Tanner, J. Toft, B. Craig, C. Davis, J.
Fung, P. Bloch, K. Fresh, S. Campbell, D. Myers, E. Iverson, A. Bailey, P. Schlenger, C. Kiblinger, P.
Myre, W. Gerstel, and A. MacLennan. 2011. Historical Change of Puget Sound Shorelines: Puget Sound Nearshore Ecosystem Project Change Analysis. Puget Sound Nearshore Report No. 201101. Published by Washington Department of Fish and Wildlife, Olympia, Washington, and U.S. Army Corps of Engineers, Seattle, Washington
Thom, R. M., A. B. Borde, S. Rumrill, D. L. Woodruff, G. D. Williams, J. A. Southard, and S. L Sargeant. 2003. Factors influencing spatial and annual variability in eelgrass (Zostera marina L.) meadows in Willapa Bay, Washington, and Coos Bay, Oregon, estuaries. Estuaries 26:1117-1129.
115
Thom, RM, J Vavrinec, JL Gaeckle, L Aston, KE Buenau, DL Woodruff, and AB Borde. 2014. Eelgrass (Zostera marina L.) Restoration in Puget Sound: Development and Testing of Tools for
Optimizing Site Selection. September 2014. Prepared for the U.S. Department of Energy under Contract DE-AC05-76RL01830. Pacific Northwest National Laboratory, Richland, Washington 99352. PNNL-23635
Von Prause, M., 2014. River and Stream Water Quality Monitoring Report, Water Year 2013. Washington State Department of Ecology, Olympia, WA.
WDNR. 2007. Overwater Structures in Marine Waters of Washington State. vector digital data. Washington State Department of Natural Resources, Aquatics Division. July 18, 2007. Online: http://geography.wa.gov/data-products-services/data/data-catalog
WDNR. 2015. Puget Sound Eelgrass (Zostera marina) Recovery Strategy. February 2015. Washington State Department of Natural Resources, Aquatic Resources Division
WDOE. 2015. Shoreline Master Programs Handbook. Chapter 16, Aquaculture. Publication No. 11-06010, December 2015
WDOE. 2011. Shoreline Master Programs Handbook. Chapter 11, Vegetation Conservation, Buffers and Setbacks. Publication Number 11-06-010. 11/28/2011
WDOE. 2012. Preparing for a Changing Climate, Washington State’s Integrated Climate Response Strategy. April 2012. Publication No. 12-01-004. 207 pp.
Washington State Department of Ecology. 2014. Final Environmental Impact Statement: Management of Zostera japonica on Commercial Clam Beds in Willapa Bay, Washington. March 26 2014. Water Quality Program
Washington Department of Ecology. 2016. Fact Sheet Addendum for the Zostera Japonica Management On Commercial Clam Beds In Willapa Bay NPDES and State Waste Discharge General Permit. Draft Permit Modification. December 7, 2016
Wise DR, Johnson HM. Surface-Water Nutrient Conditions and Sources in the United States Pacific Northwest. Journal of the American Water Resources Association. 2011;47(5):1110-1135. doi:10.1111/j.1752-1688.2011.00580.x.
WOFM (Washington State Office of Financial Management). 2012. Projections County Growth
Management Population Projections by Age and Sex: 2010-2040. Forecasting Division August 2012. 120 pp
WOFM. 2016. Population Trends. Forecasting & Research Division. Office of Financial Management. State Of Washington. September 2016. 54 pp
Wright, SL, RC Thompson and TS Galloway. 2013. The physical impacts of microplastics on marine organisms: A review. Environmental Pollution 178 (2013) 483-492
116
AQUACULTURE CUMULIATIVE EFFECTS ANALYSIS REVIEW SCHEDULE (February 2017)
|
REVIEWER and WRITER |
First Draft issued for review |
Reviewers response to comments |
Comments meeting (if needed) |
Second draft issued for review |
Reviewers response to comments |
Comments meeting (If needed) |
Finalize Document |
|
|
1 Feb |
6 Feb |
7 Feb |
9 Feb |
13 Feb |
14 Feb |
17 Feb |
|
Pozarycki |
X |
|
X |
X |
|
X |
X |
|
Harrington |
|
X |
X |
X |
|
X |
|
|
Sanguinetti |
|
X |
X |
|
X |
X |
|
|
Tillinger |
|
X |
X |
|
X |
X |
|
|
Bennett |
|
X |
X |
|
X |
X |
|
|
Walker |
|
X |
X |
|
X |
X |
|
|
McGowan |
|
X |
X |
|
X |
X |
|
|
Gesl? |
|
|
|
|
|
|
|
|
Derosa? |
|
|
|
|
|
|
|
-
In this document, underwater sound pressure levels given in units of dB RMS and dB peak are referenced to a pressure of 1 microPascal and sound pressure levels given in dB SEL (sound exposure level) are referenced to 1 microPascal2 second unless otherwise noted. ↑
+++++++++++++++++++++++++++++++++++++++++++++++++++++++++++++++++++++++++Cumulative Impacts Analysis for 2017 Nationwide Permit 48
Table of Contents
1. Introduction …………………………………………………………………………………………………………………3 2. Proposed Action ……………………………………………………………………………………………………………5
2.1. Nationwide permit 48 …………………………………………………………………………………………….5
2.2. General Conditions ………………………………………………………………………………………………..6
2.3. Regional Conditions ……………………………………………………………………………………………….7
2.4. Description of Work and Activities …………………………………………………………………………….8
2.5. Geographic area …………………………………………………………………………………………………. 39 2.6. Indirect Activities ………………………………………………………………………………………………… 45 3. Effects of the Action ……………………………………………………………………………………………………. 47
3.1. Effects of Individual Activities ………………………………………………………………………………… 47
3.2. Spatial Extent and Frequency of Effects ……………………………………………………………………. 54
3.3. Summary of Primary Effects by Region …………………………………………………………………….. 61 4. Cumulative Impacts …………………………………………………………………………………………………….. 66
4.1. Scope of Analysis ………………………………………………………………………………………………… 68
4.2. Eelgrass …………………………………………………………………………………………………………….. 71
4.3. Pacific sand lance and surf smelt…………………………………………………………………………… 103
5. References ………………………………………………………………………………………………………………. 113
2
1. Introduction
The U.S. Army Corps of Engineers (Corps) issues nationwide permits (NWPs) to authorize activities under Section 404 of the Clean Water Act and Section 10 of the Rivers and Harbors Act of 1899 that will result in no more than minimal individual and cumulative adverse environmental effects. There are currently
50 NWPs. These NWPs were published in the February 21, 2012, issue of the Federal Register (77 FR 10184) and expire on March 18, 2017.
The Corps conducts a NEPA and 404(b)(1) analysis for each NWP at a national level and produces a decision document summarizing the results. The decision document for NWP 48 concludes that there will be no individual or cumulative adverse impacts and that regional analysis will be conducted to ensure impacts will be minimal. Identified adverse impacts will be minimized through the use of regional conditions if necessary.
The decision document also indicates that:
“An important aspect for the NWPs is the emphasis on regional conditions to address differences in aquatic resource functions, services, and values across the nation. All Corps divisions and districts are expected to add regional conditions to the NWPs to enhance protection of the aquatic environment and address local concerns. Division engineers can also revoke an NWP if the use of that NWP results in more than minimal individual and cumulative adverse environmental effects, especially in high value or rare wetlands and other waters. When an NWP is issued or reissued by the Corps, division engineers issue supplemental decision documents that evaluate potential impacts of the NWP at a regional level, and include regional cumulative effects assessments.
Corps divisions and districts also monitor and analyze the cumulative adverse effects of the NWPs, and if warranted, further restrict or prohibit the use of the NWPs to ensure that the NWPs do not authorize activities that result in more than minimal individual and cumulative adverse environmental effects. To the extent practicable, division and district engineers will use regulatory automated information systems and institutional knowledge about the typical adverse effects of activities authorized by NWPs, as well as substantive public comments, to assess the individual and cumulative adverse effects on the aquatic environment resulting from regulated activities.”
The purpose of this analysis is to assess the cumulative effects associated with authorizing activities under the 2017 NWP 48 in the state of Washington. The analysis assumes only limited general conditions on work conducted under the permit as described below. The purpose of conducting the analysis in this manner is to determine whether or not additional regional conditions may be necessary to ensure that only minimal cumulative adverse environmental impacts occur consistent with requirements of the permit and the national Corps decision document referenced above. The cumulative effects analysis is structured consistent with NEPA and 404(b)(1) requirements per Corps regulations. The CEQ (40 C.F.R. § 1508.7) provides the following definition of cumulative effects: “the impact on the environment which results from the incremental impact of the action when added to other past, present, and reasonably foreseeable future actions regardless of what agency (Federal or non-Federal) or person undertakes such other actions.” The CEQ guidance document “Considering Cumulative Effects Under the National Environmental Policy Act” provides the basis for the structure and preparation of the analysis (CEQ 1997).
3
4
2. Proposed Action
2.1. Nationwide permit 48
The proposed action is the administration and implementation of the 2017 version NWP 48 in Washington State. The time period for the action is March 19, 2017 until March 18, 2022 which is the time period 2017 NWP 48 will be in effect.
The text of 2017 NWP 48 is as follows:
Commercial Shellfish Aquaculture Activities. Discharges of dredged or fill material into waters of the United States or structures or work in navigable waters of the United States necessary for new and continuing commercial shellfish aquaculture operations in authorized project areas. For the purposes of this NWP, the project area is the area in which the operator is authorized to conduct commercial shellfish aquaculture activities, as identified through a lease or permit issued by an appropriate state or local government agency, a treaty, or any easement, lease, deed, contract, or other legally binding agreement that establishes an enforceable property interest for the operator. A “new commercial shellfish aquaculture operation” is an operation in a project area where commercial shellfish aquaculture activities have not been conducted during the past 100 years.
This NWP authorizes the installation of buoys, floats, racks, trays, nets, lines, tubes, containers, and other structures into navigable waters of the United States. This NWP also authorizes discharges of dredged or fill material into waters of the United States necessary for shellfish seeding, rearing, cultivating, transplanting, and harvesting activities. Rafts and other floating structures must be securely anchored and clearly marked.
This NWP does not authorize:
- The cultivation of a nonindigenous species unless that species has been previously cultivated in the waterbody;
- The cultivation of an aquatic nuisance species as defined in the Nonindigenous Aquatic Nuisance Prevention and Control Act of 1990;
- Attendant features such as docks, piers, boat ramps, stockpiles, or staging areas, or the deposition of shell material back into waters of the United States as waste; or
- Activities that directly affect more than 1/2-acre of submerged aquatic vegetation beds in project areas that have not been used for commercial shellfish aquaculture activities during the past 100 years.
Notification: The permittee must submit a pre-construction notification to the district engineer if: (1) the activity will include a species that has never been cultivated in the waterbody; or (2) the activity occurs in a project area that has not been used for commercial shellfish aquaculture activities during the past 100 years. If the operator will be conducting commercial shellfish aquaculture activities in multiple contiguous project areas, he or she can either submit one PCN for those contiguous project areas or submit a separate PCN for each project area. (See general condition 32.)
5
In addition to the information required by paragraph (b) of general condition 32, the preconstruction notification must also include the following information: (1) a map showing the boundaries of the project area(s), with latitude and longitude coordinates for each corner of each project area; (2) the name(s) of the species that will be cultivated during the period this NWP is in effect; (3) whether canopy predator nets will be used; (4) whether suspended cultivation techniques will be used; and (5) general water depths in the project area(s) (a detailed survey is not required). No more than one pre-construction notification per project area or group of contiguous project areas should be submitted for the commercial shellfish operation during the effective period of this NWP. The pre-construction notification should describe all species and culture activities the operator expects to undertake in the project area or group of contiguous project areas during the effective period of this NWP. If an operator intends to undertake unanticipated changes to the commercial shellfish aquaculture operation during the effective period of this NWP, and those changes require Department of the Army authorization, the operator must contact the district engineer to request a modification of the NWP verification; a new pre-construction notification does not need to be submitted. (Authorities: Sections 10 and 404)
Note 1: The permittee should notify the applicable U.S. Coast Guard office regarding the project.
Note 2: To prevent introduction of aquatic nuisance species, no material that has been taken from a different waterbody may be reused in the current project area, unless it has been treated in accordance with the applicable regional aquatic nuisance species management plan.
Note 3: The Nonindigenous Aquatic Nuisance Prevention and Control Act of 1990 defines “aquatic nuisance species” as “a nonindigenous species that threatens the diversity or abundance of native species or the ecological stability of infested waters, or commercial, agricultural, aquacultural, or recreational activities dependent on such waters.”
2.2. General Conditions
To qualify for NWP authorization, the prospective permittee must comply with 32 general conditions, as applicable, in addition to any regional or case specific conditions imposed by the division engineer or district engineer.
The general conditions allow for discretion with respect to their applicability (e.g., ‘to the maximum extent practicable’) in most cases or defer to other agencies for additional requirements. In practice it is uncertain whether any of the general conditions would minimize effects of the action. Historically, these conditions have not been invoked to restrict activities under NWP 48. In all cases but one, the cumulative effects analysis assumes no additional requirements placed on the work beyond that described in the action description above. This results in a worst-case environmental effects analysis.
General condition 11 is the one exception whereby it is assumed that all heavy equipment will be transported to work sites by vessel at high tide so as not to impact aquatic areas through the creation of roads in the mudflat or to otherwise disturb the nearshore habitat beyond the project area.
6
2.3. Regional Conditions
For the purpose of this analysis, it is assumed no regional conditions will be applied to the work conducted under the 2017 NWP 48.
7
2.4. Description of Work and Activities
This section describes the range of work and activities that are included within the 2017 NWP 48. The information was gathered from multiple sources including PCSGA (2011; 2013a; 2013b), WDNR (2008; 2013), Corps (2014a) and from knowledge of the professional Corps staff that have been involved in regulating shellfish activities. There is wide variation in the manner in which individual shellfish activities are conducted and the equipment/materials used. The descriptions below are considered generally representative of the individual activities but variability inherent within individual activities is not necessarily captured. The work and activities are summarized in Section 2.4.6. Section 2.5.1 describes the acreage of the work and activities by geographic region. These two components (general description and acreage) together describe the work that would be authorized by the Corps under the proposed action.
2.4.1. Mussel Activities
There are two species of mussels cultured in Washington State marine waters. These include Mytilus trossulus, commonly known as the blue mussel and Mytilus galloprovincialis, commonly known as the Mediterranean or Gallo mussel. The blue mussel is native to Washington State. The mussel activities described below may be performed at any time of day and at any time of year. They are not dependent on season or tides.
2.4.1.1. Rafts, Floats, other Structures, and Surface Longlines
Mussels are typically grown suspended from rafts or surface longlines anchored in subtidal waters, but they can be grown from any structure (e.g., pier) where there is adequate water depth at low tide. A raft is considered an open-framed floating structure with cross beams. Raft platforms are constructed of lumber, aluminum, galvanized steel, and plywood with some form of flotation. Lines with attached mussels are suspended from the raft. There may be multiple rafts for one activity footprint (Figure 2-1).
A float is a floating platform structure, typically rectangular, that is either anchored or attached to a pier or dock. Floats are used as working platforms, storage or for mooring boats. A float can be towed into place for anchoring.
Other structures the Corps would permit under the proposed action are discharge and intake pipes associated with upland wet-storage tanks. These tanks are placed in upland areas and used for holding shellfish species for some period of time. Water is circulated through the tanks via pipes that extend from the tanks to the nearby marine waters. There would typically be pipes for both intake and discharge. The activity must be compliant with Section 402 of the Clean Water Act (National Pollutant Discharge Elimination System (NPDES)) and have an NPDES permit, if necessary, before the Corps would issue a permit or verification under the proposed action. The upland wet-storage tanks themselves and their associated discharge are not within the regulatory jurisdiction of the Corps so would not be permitted under the proposed action.
8

Figure 2-1. Penn Cove Shellfish mussel rafts and harvest barge (Everett Herald 2013)
Surface or floating longlines are typically made of heavy polypropylene or nylon rope suspended by floats or buoys or they could be suspended from a structure such as a pier. They can consist of a single buoy and rope with attached cultured species extending below the buoy and anchored to the substrate. They can consist of multiple buoys connected by rope extending horizontally across the water surface for hundreds of feet. Rope with cultured species would be hung at intervals along this horizontal line. Large anchors to the substrate may also be placed at intervals along the line and at each end.
Seeding and Planting
Naturally-spawned mussel seed are set on lines or metal screen frames in net cages that are suspended in the water during the late spring spawning season. Hatchery seed, when used, is already set on lines or screen frames at the nursery, and then transported to the mussel farm for planting. Once the seed reaches 6 to 12 millimeters long, which can take several months in winter or several weeks in summer, it is scraped from the frames or stripped from the lines and sluiced into polyethylene net sausage-like tubes, called “socks,” each with a strand of line threaded down the length of the sock for strength. A mussel disc may be inserted into the socks at intervals to support the weight of the mussels growing above it. Concrete weights with stainless steel wire hooks are hung on the bottom end of each mussel sock for tension. The socks are then attached to the raft or surface longline (Figure 2-2).
Maintenance and Grow-out
When the mussels reach about 1 inch in length, the weights are often removed from the socks and saved for reuse. Predator exclusion nets are hung around the perimeter of the rafts. Nets may be in place all year or may be used seasonally. If the predator exclusion nets become excessively fouled (e.g., with barnacles, algae, other aquatic vegetation or biological growth), they may be cleaned in place by hand or by mechanical methods. They may also be removed and then cleaned. Fouling organisms may also be removed from the raft structure itself.
9


Figure 2-2. Commercial mussel raft in south Puget Sound (Corps site visit 2013)
10
Harvest
When cultured mussels reach market size, about 12 to14 months of age, socks or lines of mussels are removed from the longline or raft for cleaning and grading. Biofouling is typically removed from mussels during harvest as the mussels are cleaned. The waste material is commonly returned to the water or put into a shell pile on shore. The mussels are stripped from the socks and bulk-bagged and tagged for transport to shore. Mussels that fall from the lines onto the predator nets or the bottom substrate may be harvested by hand or by suction dredge. Weights are reclaimed for re-use, and used socking and lines are recycled or disposed of at an appropriate waste facility. Harvesting occurs year round as mussels mature.
2.4.1.2. Mussel Bottom Culture
Mussel bottom culture entails growing mussels directly on the bottom substrate or in/on a container that is supported on the substrate. This may include growing mussels in bags or on trays supported on the substrate as described in the following sections for oyster and clams. Bottom culture could entail harvesting natural set mussels on stakes placed into the substrate or recruited to the substrate directly. The culture and harvest activities are similar to oyster stake and rack and bag culture methods. The reader is referred to the oyster stake and rack and bag sections for more detail on how this activity would be conducted.
2.4.2. Oyster Activities
Several species of oysters are cultured on the West Coast including the Pacific oyster (Crassostrea gigas), Kumamoto oyster (Crassostrea sikamea), Eastern oyster (also known as American oyster) (Crassostrea virginica), European flat oyster (Ostrea edulis), and the Olympia oyster (Ostrea conchaphila). Only the Olympia oyster is native to Washington State.
Oyster ground is often classified or referred to by its use, such as seed ground, grow-out ground, or fattening ground. There are four general strategies for oyster culture which depend on target markets, beach characteristics, and environmental conditions. These strategies include stake culture, rack-andbag culture, bottom culture, and longline culture.
Many oyster activities are performed by workers on foot during low tides that expose the culture bed. The lowest tides occur for a period of several days each lunar month (29 days). During these low tides, workers may be present on the bed for 3 to 6 hours. In this document, work performed during these monthly low tides is described as occurring “during low tide.” Work can occur at any time of the year; although, traditionally, December through January has been a strong market for commercially harvested oysters. Oysters are typically harvested between 18 months and 4 years of age (Corps 2014a).
Oyster activities may also be performed at high tides or in the subtidal zone. These work activities would not be dependent on tides and could occur at any time of the year. Harvest activities may occur at any time.
The oyster activities discussed below all generally use oyster cultch as a basis for the culture. Oyster cultch is oyster shell with attached oyster seed (or spat). Cultch is prepared by bundling washed and aged Pacific oyster shells (“mother shells”) in plastic mesh bags which are then placed in the intertidal zone prior to spawning season. Up to thousands of cultch bags may be required for a single oyster
11
operation. Naturalized seed then collects on the bags of shell which creates the oyster cultch. Stakes with attached shell or ‘hummocks’ of shell placed in intertidal areas may also be used to collect naturalized seed. Alternatively, seeding of the mother shells may occur in an upland hatchery. The cultch bags remain in the intertidal zone, either loose or on pallets, until the seed is large enough or “hard” enough (i.e., firmly cemented onto the mother shell and able to resist predation and desiccation) to withstand being moved onto the culture beds (Figure 2-3).

Figure 2-3. Oyster cultch shell with spat stacked on pallets (Corps site visit 2013)
2.4.2.1. Rafts, Floats, FLUPSYs, and other Structures
Oyster activities do not use structures to the same extent as mussel activities. Rafts/floats may be used as work platforms while oyster activities are occurring at a site. These rafts/floats may be anchored to the substrate or attached to a vessel. Rafts and FLUPSY floats may also be used to grow-out seed. A FLUPSY is a type of float structure specifically used for growing out seed to a larger size (Figure 2-4). Because it requires a power connection, FLUPSYs may be placed in the intertidal zone adjacent to power sources, such as attached to a pier. The floating structure continuously draws seawater through the system. Juvenile shellfish, one to two millimeters in length, are transported to a FLUPSY from a shellfish hatchery. The seed is placed in bins with screened bottoms that are lowered into openings in a floating frame and suspended in the seawater. Several bins are placed in a row on either side of a central enclosed channel that ends at a paddlewheel or pump. The wheel or pump draws water out of the central channel creating an inflow of seawater through the bottom of the seed bins, continuously feeding the juvenile shellfish. The outflow from the bins is through a dropped section on one side of the bin facing the central channel. Typically, the FLUPSY platform is equipped with overhead hoists so the bins can be cleaned and moved. Once seed have reached a suitable size, they are removed from the FLUPSY and transplanted to a grow-out site
Trays or bins elevated above the substrate may be used for additional seed grow-out or nursery seed boosting. Trays or bins are affixed to racks set on the substrate. Racks have typically been made of
12
rebar, angle iron, and in rare cases, wood and or plywood. Trays are typically made of plastic. Racks may be deployed for a few months or longer. There may also be use of what are termed “stackable nester trays” for boosting seed. Tidal depths for elevated trays on racks vary from a +3 feet to -15 feet Mean Lower Low Water. Trays or bins may also be placed directly on the substrate (PCSGA 2013a).

Figure 2-4. A FLUPSY (Fisher Island Oysters 2007 in PCSGA 2011)
Upland wet-storage tanks, as described above for mussel activities, could also be used for oyster activities. The Corps would permit the pipes (for both discharge and intake) associated with these tanks under the proposed action.
2.4.2.2. Oyster Floating Culture
Oyster floating culture occurs using lantern nets, bags, trays, cages, or vertical ropes or wires suspended from surface longlines or rafts similar to that described above for mussels. Floating culture occurs in the subtidal zone. Surface longlines are heavy lines suspended by floats or buoys attached at intervals along the lines, anchored in place at each end. Lantern nets, adopted from Japanese shellfish culture, are stacks of round mesh-covered wire trays enclosed in tough plastic netting. The nets, bags, trays, cages, or vertical ropes or wires are hung from the surface longlines or rafts.
Seeding
Single set oyster seed is placed on the trays or in the bags and suspended in the water. Oyster cultch may be attached directly to the vertical ropes or wires.
Maintenance and Grow-out
Single oysters are regularly sorted and graded throughout the growth cycle. Every three or four months trays are pulled, the stacks taken apart, and oysters are put through a hand or mechanical grading process. The trays are then restocked, stacks rebuilt, de-fouled by removing species such as barnacles, algae and other aquatic vegetation, and returned to the water. Oysters grown directly on vertical lines are in clusters and receive little attention between seeding and harvesting.
13
Harvest
A vessel equipped with davits and winches works along the lines, and the trays, nets or bags are detached from the line one by one and lifted into the vessel. The gear is typically washed as it is pulled aboard. Oysters are removed and placed into tubs where they may be cleaned and sorted.
Oysters grown using floating culture may be transplanted to an intertidal bed for two to four weeks to “harden”. Hardening extends the shelf-life of floating cultured oysters by literally hardening the shell making it less prone to chipping, breakage, and mortality during transport and conditioning them to close their shells tightly when out of the water to retain body fluids. Oysters are re-harvested from the transplanted areas using bottom culture harvest methods. Alternatively, oysters grown by floating culture may be hung from docks at a tidal elevation that results in hardening them.
2.4.2.3. Oyster Bottom Culture
Bottom culture entails growing oysters directly on the substrate in intertidal or shallow subtidal areas (Figure 2-5).
Seeding and Planting
Prior to planting, oyster beds are prepared by removing debris such as driftwood, rocks, and predators (e.g., starfish, oyster drills) by hand or mechanically by dragging a chain or net bag. Any oysters that remain on site from the previous growing cycle may be removed or thinned. In some areas the substrate may occasionally be enhanced with crushed oyster shells often mixed with washed gravel to harden the ground (see discussion of graveling in Section 2.4.3).
Seeding occurs by spraying oyster cultch from the deck of a barge or casting it by hand. In some cases, farms rely solely on the natural set of oyster seed. Oyster hummocks may be created by mounds of oyster shell which provide a substrate more conducive to attracting natural seed (Figure 2-5).
Maintenance and Grow-out
Oysters may be transplanted from one site to another at some point during grow-out. For example, oysters may be moved from an initial growing area to “fattening” grounds with higher levels of nutrients allowing the oysters to grow more rapidly. Oysters may be removed for transplant either by hand or by dredge.
Oysters may sink into the mud in areas where the substrate is soft. When this happens, the oysters are harrowed to pull them up out of the mud. The harrow is a skidder with many tines, towed along the substrate by a boat. The harrow penetrates the substrate by a few inches, breaking up the oyster clusters, and moves the oysters back to the surface. This method is also referred to as “dragging”. Dragging is typically performed during the second or third year of growth. Oyster dredge-harvest vessels are used for dragging by substituting the dredge baskets with drag tools which they hang on the outrigger cables. About five acres can typically be harrowed in one day (Corps 2014a).
Harvest
Harvest typically occurs either by hand during low tide or by dredge. During hand harvest, workers use hand tools or hand-pick oysters and place them into various sized containers placed on the bed (Figure 2-6). Larger containers may be equipped with ropes and buoys that can be lifted with a boom crane
14
onto the deck of a barge at high tide. Smaller containers are sometimes placed or dumped on decks of scows for retrieval at high tide or are carried off the beach at low tide.
Mechanical or dredge harvest occurs by use of a harvest bag that is lowered from a barge or boat by boom crane or hydraulic winch at high tide and pulled along the bottom to scoop up or ‘dredge’ the oysters. The dredge bags have a leading edge (blade) consisting of a steel frame with teeth and a steel mesh collection bag attached to the frame. As the dredge bags are towed across the substrate, the oysters are loosened and guided into the bags. The bag is then hoisted onto the boat deck, emptied, and then redeployed. Two dredge bags may be towed simultaneously off each side of the boat. The boats, such as the one shown in Figure 2-7, can haul large volumes that can weigh over twenty tons. Dredge equipment can typically be adjusted so that the correct depth is dredged as tide levels change.
A given area may be dredged twice in succession to ensure recovery of the maximum number of oysters (Corps 2014a). Harrowing may occur between the two successive dredge events in order to increase recovery of oysters. Alternatively, the area may be hand harvested at low tide after initial dredging to obtain any remaining oysters.

15
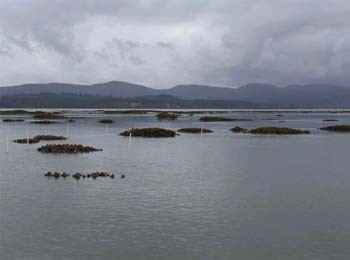
Figure 2-5. Oyster bottom culture (top) and hummocks (bottom), Willapa Bay (UW 2015)
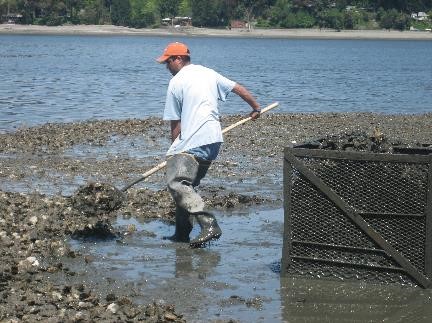
Figure 2-6. Hand harvest of oysters, South Puget Sound (Taylor Shellfish 2013)
One crop of oysters is typically dredged twice before actually being harvested. In some case, oysters may be dredged at about one year and then transplanted to a grow-out bed. In other cases, the oysters may not be transplanted to a finishing (fattening) bed until they are closer to harvest size. Dredging can be accomplished at a rate of one acre harvested every two days depending on the time of year and
16
density of oysters (Corps 2014a). In summary, an individual oyster bed may commonly be dredged a total of three times over the plant to harvest cycle.
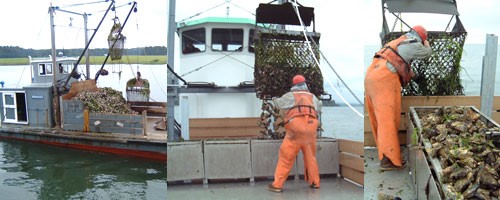
Figure 2-7. Oyster dredge in Willapa Bay (Bay Center Farms 2015)
2.4.2.4. Oyster Longline Culture
In longline culture, oysters are grown in clusters on rope lines suspended off the bottom (typically 3 feet or less) between upright stakes made of PVC or metal pipe. This method keeps the oysters from sinking into soft substrates and minimizes their exposure to predators. Since the activity is supported by structures placed on the substrate, it is considered a ground-based culture method in this document to differentiate it from the floating or surface longlines discussed previously.
Seeding and Planting
Bed preparation activities are similar to those described above under bottom culture with the following additions. Residual oysters (“drop offs”) dislodged from the lines during the previous growing cycle are typically harvested using bottom culture methods. The substrate may be leveled either manually or by mechanical means to address accumulations of sediment that have occurred since the previous planting cycle. If the PVC or metal stakes were removed after the previous harvest they are replaced by hand. When bed preparation is complete, long polypropylene or nylon lines with a piece of seeded oyster cultch attached approximately every foot are suspended above the ground between the stakes.
Maintenance and Grow-out
The oysters grow in clusters supported by the longlines over a period of 2 to 4 years (Figure 2-8). The longlines are checked periodically during low tides to ensure that they remain secured to the pipe and that the pipe remains in place. Periodic control of fouling organisms (e.g., mussels, barnacles, algae and other aquatic vegetation) and predator species may take place.
17
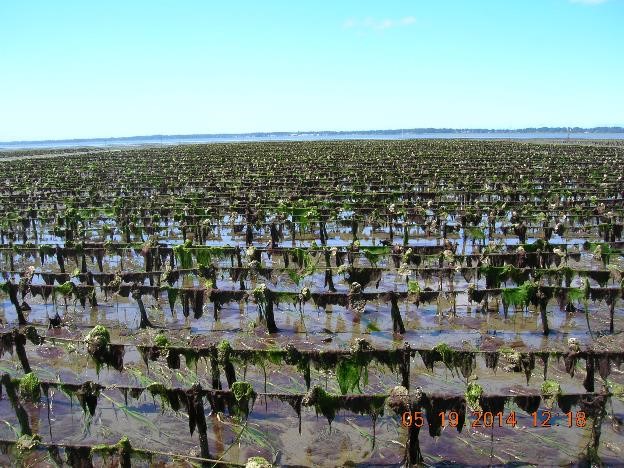
Figure 2-8. Oyster longline culture, Willapa Bay (Corps site visit 2014).
Harvest
Longline oysters may be harvested by hand or by machine. Hand harvest entails cutting oyster clusters off lines by hand at low tide and placing the clusters in harvest tubs equipped with buoys for retrieval by a vessel with a boom crane or hydraulic hoist at a higher tide. The oysters are then barged to shore. Some smaller operations carry the tubs off the beach by hand.
With mechanical harvesting, buoys are attached at intervals along the lines at low tide. During high tide the buoys are attached to a reel mounted on a vessel that pulls the lines off the stakes and reels them onto the boat. The oyster clusters are cut from the lines and then transported to processing plants or market. Some attached biological material (e.g., barnacles, algae) may incidentally fall off the lines during harvest. The oysters are removed from the lines at the processing facility and the line disposed of as waste material. Barnacles and mussels that remain on the lines are removed and may be re-used for their shell material.
About 5,000 to 7,500 sq. ft. (1/8 acre) can be harvested in one day (Corps 2014a). Pipes are often pulled after harvest and the area then harrowed and dredged to collect the remaining oysters. The ground could then be dragged with a chain or net bag to level it and remove debris before replacing stakes for
18
the next cycle. Alternatively, stakes may remain in place depending on the environmental and substrate conditions.
2.4.2.5. Oyster Stake Culture
Oyster stake culture consists of metal or PVC stakes regularly spaced across the growing site with oysters attached directly to the stakes.
Seeding and Planting
Bed preparation methods are similar to those described above under bottom and longline culture. During low tides, stakes made of hard-surfaced material such as metal or PVC pipe are driven into the ground approximately two feet apart to allow water circulation and easy access at harvest. Stakes are limited to two feet in height to minimize obstruction to boaters.
Stakes can be seeded in upland hatchery setting tanks before being planted in the beds or transported to the site as bare stakes where there is a reliable natural seed set. Bare stakes might be planted during the prior winter to allow barnacles and other organisms to attach to the stakes, increasing the surface area available for setting oyster spat. An alternative method of seeding is to attach one to several pieces of seeded oyster cultch to each stake.
Maintenance and Grow-out
Stakes are left in place throughout a two to four year growing cycle. In areas where natural spawning occurs, multiple year classes of oysters grow on the stakes, with smaller, younger oysters growing on top of older oysters. The area is maintained by periodically checking stakes to ensure they remain upright and by removing fouling organisms (e.g., mussels, barnacles, algae and other aquatic vegetation) and predators. Stakes may be repositioned or replaced as needed. Some oysters may be periodically removed to relieve overcrowding. Oysters that fall from or are knocked off the stakes are harvested periodically by hand. They may be transplanted to firmer ground to improve their condition for harvest at a later time.
Harvest
Oysters are selectively hand harvested during low tide by prying clusters of market-sized oysters from the stakes or removing the stakes entirely. They are placed in containers and either hand carried off the beach or loaded on a boat for transport to shore. Undersized single oysters from the clusters may be transplanted to a special bed for grow-out since they cannot reattach to the stakes. They would then be harvested using bottom culture methods when they reach market size. Market-sized drop-offs that have not settled into the mud are harvested along with those pried from the stakes.
Fouling organisms would typically be dislodged during harvest. Stakes that are removed for reuse would be allowed to dry in an upland location to remove biofouling. Shell material may be stored for reuse.
2.4.2.6. Oyster Rack and/or Bag Culture
Rack and bag or bag culture entails growing oysters within plastic bags or other containers that are placed either directly on the substrate or on racks or lines that suspend the bags above the substrate.
19
Seeding and Planting
Bed preparation methods are similar to those described above for the other oyster culture methods. During low tide, longlines and PVC/metal stakes may be installed on the bed to secure the bags. Wood or metal racks could also be installed to keep the bags off the ground. Racks with legs may be placed directly on the substrate, or supports may be driven into the substrate. Single-set seed or oyster cultch is placed in reusable plastic net bags closed with plastic ties or galvanized metal rings. Bags are attached to the racks, stakes, or lines using reusable plastic or wire ties.

Figure 2-9. Oyster bag culture, south Puget Sound (NOAA Photo as reported in InsideBainbridge 2015)
In some cases, oysters are cultivated using a tumble bag system (Figure 2-10). Oyster tumbling involves attaching a buoy and securing the bags to a single horizontal stainless steel rod held in place by rebar stakes driven into the substrate. The oyster-seed filled bags pivot on the rod and float with the tide. The ebb and flow of the tide agitates the oysters or “tumbles” them.
20

Figure 2-10. Oyster rack and bag tumbling system, South Puget Sound (Corps site visit 2013)
Maintenance and Grow-out
Oysters are left to grow in the bags. The operation is checked periodically during low tides to ensure that the bags remain secure and to remove fouling organisms (e.g., mussels, barnacles, algae and other aquatic vegetation) and predators. Bags may be turned as often as every two weeks to control fouling organisms. Oysters may be periodically redistributed between bags to reduce densities. Oysters may be placed in progressively larger mesh size bags as the oysters grow.
Harvest
Oysters are harvested at low tide by removing the bags from their supports and transferring them to a boat, wheelbarrow, or vehicle for transport to shore. Bags may also be loaded on a boat at higher tides. Biofouling is common on the bags with barnacles and mussels the primary fouling organisms. To removal biofouling, bags are typically placed in upland areas where they are allowed to dry which allows for easier removal of fouling organisms prior to re-use. The activity to ‘dry’ bags typically occurs during the summer months.
21
2.4.3. Clam Activities
Several species of clams are cultured or harvested in Washington State including the littleneck clam (Leukoma staminea), Manila clam (Venerupis philippinarum), butter clam (Saxidomus gigantea), Eastern soft shell clam (Mya arenaria), horse clam (Tresus nuttallii and Tresus capax), razor clam (Siliqua patula), and the cockle (Clinocardium nuttallii). The most commonly cultured clam, the Manila clam, is not native to Washington State.
The following clam activities could occur any time of the year.
2.4.3.1. Rafts, Floats, FLUPSYs, and other Structures
Rafts, floats and FLUPSYs are used less in clam activities than they are in oyster and mussel activities.
Their use for clam culture would be similar to that described above in the mussel and oyster sections.
Upland wet-storage tanks, as described above for mussel activities, could be used for clam activities. The Corps would permit the pipes (for both discharge and intake) associated with these tanks under the proposed action.
2.4.3.2. Clam Bottom Culture
Bottom culture entails growing clams directly on the substrate of intertidal areas.
Seeding and planting
Prior to planting clam seed on the tidelands, beds are prepared in a number of ways depending on the location. Bed preparation activities are similar to those described above for oyster bottom culture. The substrate may be prepared by removing aquatic vegetation, mussels, and other undesired species. Any shellfish present on site may be harvested to reduce competition. These activities could be conducted by hand or by mechanical means (e.g., water jet, harrowing).
Graveling (also called frosting) is a common activity employed for clam culture. This consists of adding gravel and/or shell when the tide is high enough to float a barge. Graveling by vessel often occurs during about a two hour window at slack tide. Applying at the slack tide allows for a more accurate placement of the graveling material. In a 1-2 hour period, about 1 acre can be graveled to a depth of up to 1 inch (Corps 2014a). Several thin layers of material may be placed over a period of days (Figure 2-12). To place a single 0.5-inch layer requires about 70 cubic yards of washed gravel or shell per acre. An individual site would not be graveled more frequently than once per year. Many sites are graveled annually whereas other may be graveled at a lesser frequency.
Clam seed is typically acquired from hatcheries and planted in the spring and early summer. Intertidal trays or bags may be used as nursery systems until seed is of sufficient size to plant. The trays are typically two-foot by two-foot with ¼ inch diameter openings that permit water to flow through. They are employed in stacks of six or seven, and placed in the lower intertidal areas secured with rebar or anchored with sand bags. Clam bags as described in the section on bag culture can also be used to hold clams in a nursery system. Natural spawning and setting of clams also occurs. Clam seed sizes and methods of seeding vary, depending on site-specific factors such as predation and weather conditions. Planting methods include hand-spreading seed at low tide upon bare, exposed substrate; handspreading seed on an incoming tide when the water is approximately four inches deep; hand-spreading
22
seed on an outgoing tide when the water is approximately two to three feet deep; or spreading seed at high tide from a boat.

Figure 2-11. Adding gravel to a clam bed (i.e., graveling) (PCSGA 2011)
Immediately after seeding, cover nets may be placed over the seeded areas to protect clams from predators such as crabs and ducks. Cover nets are typically made from plastic such as polypropylene (Figure 2-12). The net edges are typically buried in a trench or weighed with a lead line and secured with rebar stakes. Predator cover netting typically remains on site until harvest.
Maintenance and Grow-out
After each growing season, surveys may be conducted during low tide to assess seed survival and distribution, and to estimate potential yield. Based on survey results, additional seeding activity may occur. Netting used to protect clams from predation can become fouled with barnacles, mussels, aquatic vegetation (e.g., algae, eelgrass) or other organisms. The nets usually remain on site throughout the growing period. Fouling organisms may be removed by hand or by mechanical means while the nets are in place. Depending on local conditions, net cleaning may occur as often as monthly or not at all. Biofouling occurs most frequently during the late spring and summer months.
Harvest
Before harvest begins, bed boundaries may be staked and any predator netting folded back during a low tide. Hand harvesters dig clams during low tides using a clam rake (Figure 2-13). Shovels or other hand operated tools may also be used. Market-size clams (typically about 3 years of age) are selectively harvested, placed in buckets, bagged, tagged, and removed. Undersized clams are returned to beds for future harvests. Since a given clam bed may contain multiple year classes of clams, it may be harvested on a regular schedule (such as annually) to harvest individual year classes of clams. Clams harvested for sale are generally left in net bags in wet storage. Clams are typically maintained in wet storage either directly in marine waters or in upland tanks filled with seawater for at least 24 hours in order to purge
23
sand. Upland tanks are connected to the marine waters through intake and outfall structures (pipes) that are compliant with the NPDES.

Figure 2-12. Clam cover nets in South Puget Sound (Corps site visit 2014).
Harvesting of clams also occurs with mechanical equipment (Figure 2-14). This equipment is driven on the substrate when the tide is out and excavates the substrate to a depth of about 4-6 inches in order to extract the clams. Clams are harvested after 3 years. About 0.8 acres per day of clams can be mechanically harvested which results in about 12 to 15 days of work for each acre (Corps 2014a). The use of a ‘hydraulic escalator harvester’ equipment is not included among the proposed action activities.
24
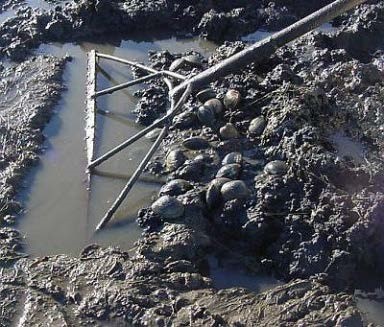

Figure 2-13. Hand harvest of Manila clams (top, Willapa Oysters 2007 in PCSGA 2011; bottom, South Puget Sound, Corps site visit 2013).
25


Figure 2-14. Mechanical harvest, low tide in North Puget Sound (GoogleEarth 2015; PSI 2015)
26
2.4.3.3. Clam Bag Culture
Clam bag culture is similar to the bag culture described previously for oysters. Clams are typically grown in plastic mesh bags placed directly on the substrate.
Seeding and Planting
Bed preparation activities are similar to those described above. Prior to setting bags on the tidelands, shallow (typically 2 to 4 inches) trenches may be dug during low tide with rakes or hoes to provide a more secure foundation for setting down the clam bags (Figure 2-13).
Clam seed (typically 5-8 millimeters) is placed in reusable plastic net bags closed with plastic ties or galvanized metal rings. Gravel and/or shell fragments may be added to the bags. Bags may be placed in shallow trenches during low tide and allowed to “silt-in” (i.e., become buried in the substrate). In high current or wind areas, bags may be held in place with 4 to 6 inch metal stakes.
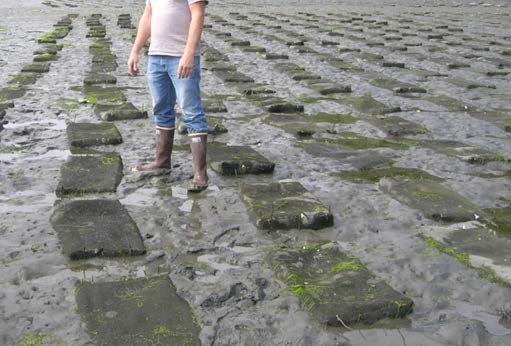
Figure 2-15. Manila clam bags set into, on the substrate (Corps site visit 2013)
Maintenance and Grow-out
Bags are monitored during low tide throughout the grow-out cycle to make sure they remain secured. They may be turned occasionally to optimize growth. Fouling organisms (e.g., mussels, barnacles, algae and other aquatic vegetation) and predators may be periodically removed.
Harvest
When the clams reach market size, the bags are removed from the growing area. Harvesting may occur when there is one to two feet of water, so that sand and mud that accumulated in the bags during growout can be sieved from the bags in place. Bags are transported to a processing site where any added substrate is separated for later reuse.
27
2.4.4. Geoduck Activities
Geoduck (Panopea abrupta) is native to Washington State and is the largest known burrowing clam. Geoduck is a relatively new species for culture. Washington is the principal state in the United States actively farming geoducks. Cultivation under the proposed action would occur between elevation +7 ft to -4.5 ft MLLW. Naturally seeded or wild geoduck could occur from about +1 ft to deeper than -100 ft MLLW.
2.4.4.1. Rafts, Floats, FLUPSYs, and other Structures
The proposed action includes reauthorization and maintenance of currently serviceable rafts, floats, and FLUPSYs that qualify as continuing activities. New rafts, floats, and FLUPSYs or the relocation or expansion of continuing rafts and floats are also included in the action. All of these types of structures have been described above in the mussel, oyster and clam sections.
2.4.4.2. Geoduck Culture Seeding and Planting
Bed preparation activities are similar to those described above. Bed preparation can also include a “preharvest” to remove all current shellfish on the bed including naturally seeded geoduck already present on the site. Undesired species such as sea stars and sand dollars (Clypeasterioda) may be removed by hand. Some growers may attempt to re-locate sand dollars to nearby suitable habitat; other growers remove them permanently from the marine environment.
The most common method of culture currently in use consists of placing a 6-inch diameter, 9-inch long PVC pipe (pipe sizes may vary among growers) by hand into the substrate during low tide, usually leaving the top section of pipe (also called a tube) exposed. Two to four seed clams (usually from hatcheries) are placed in each tube where they burrow into the substrate. Tubes are typically installed into the substrate at a density of about 1 tube per square foot or about 42,000 tubes per acre. The top of each pipe is covered with a plastic mesh net and secured with a rubber band to exclude predators (Figure 2-16). Additional cover netting may be placed over the tube field on beaches with heavy wind and wave action to guard against the tubes becoming dislodged in storms (Figure 2-17). Some growers do not use the individual pipe net covering but use the cover netting to cover the whole field of tubes. Some growers use flexible net tubes (Vexar®) instead of the PVC pipe, which eliminates the need for the additional cover netting. Intertidal geoduck culture typically ranges between the +5.0 and the -4.5 feet tidal elevation (MLLW). Geoduck seed can also be directly set into the substrate without the use of any structure.
Another method being used to exclude predators is net tunnels (Figure 2-18). The tunnels are made from 4-foot wide rolls of polyethylene net placed over a rebar frame to hold the net a couple of inches above the substrate with the net edges buried by the substrate. They are currently being used in the intertidal area. The mesh opening of the net is either 1/4-inch or 3/8-inch. A 24-inch wide net without a rebar frame may also be used.
28
Maintenance and Grow-out
Fouling organisms including mussels, cockle clams, and sand dollars often accumulate inside the tubes. Aquatic vegetation (e.g., algae and eelgrass) may also accumulate on or over the tubes. When this occurs, which could be throughout the year, these fouling organisms are removed.
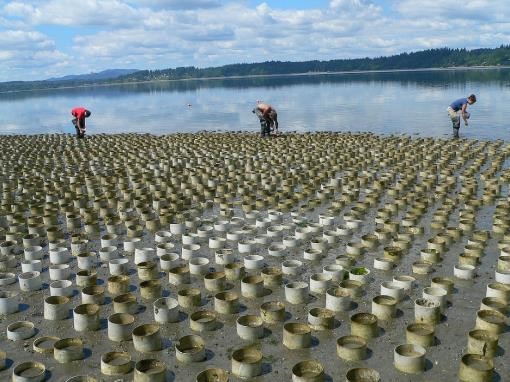
29

Figure 2-16. Geoduck cultivation using individual tube nets for predator control, South Puget Sound (top, OPB 2012) and Discovery Bay (bottom, Kitsap Sun 2015)
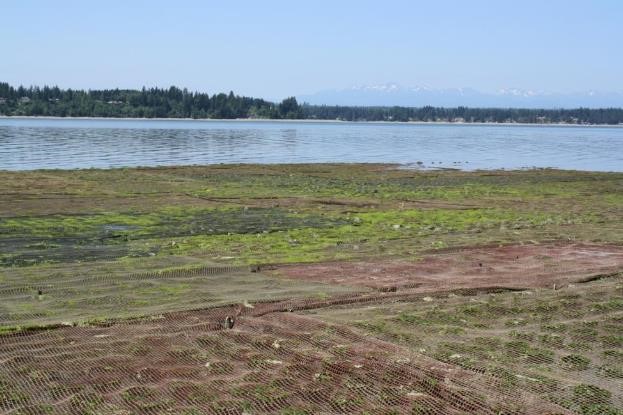
30
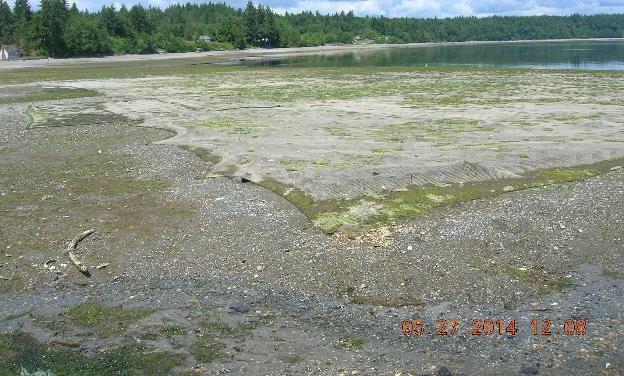
Figure 2-17. Cover netting placed over geoduck tubes, South Puget Sound (Corps site visit 2014)
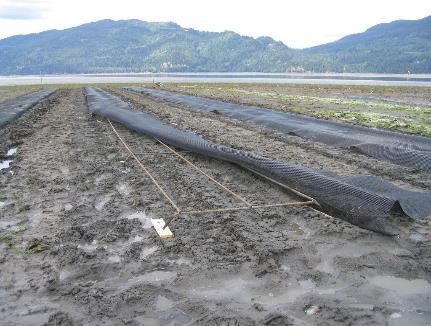
Figure 2-18. Geoduck tunnel net over rebar frame (Dewey 2013)
Tubes and netting are typically removed after 18 months to 2 years when the young clams have buried themselves to a depth sufficient to evade predators (about 14 inches). After tube removal, large area nets may be redeployed over the bed for several months. The tubes and nets are often taken to upland
31
locations and allowed to dry in order to easily remove fouling organisms. They are then typically reused. As the clams grow, they may gradually dislodge the tubes from the substrate before they can be removed. The dislodged tubes could potentially be swept away from the site by the tides.
Harvest
Naturally produced geoducks can live for more than 100 years and may be harvested at any age or size. Cultivated geoducks are typically harvested 4 to 7 years after planting or when they reach about 2 pounds. A site seeded at 160,000 per acre might be expected to produce 32,000 to 40,000 marketable geoduck per acre. The geoducks are harvested in the intertidal zone at low tide (Figure 2-19) or by divers at high tide in the intertidal or subtidal zone. In either case, the geoducks are typically harvested using hand-operated water jet probes. For water jet harvest, the probe is a pipe about 18 to 24 inches long with a nozzle on the end that releases surface-supplied seawater from a 1-inch internal diameter hose at a pressure of about 40 pounds per square inch (about the same pressure as that from a standard garden hose) and a flow of up to 20 gallons per minute.
This harvest method allows the hand extraction of geoducks, which burrow as deep as 3 feet. The harvester inserts the probe in the substrate next to an exposed geoduck siphon or the hole left when the siphon is retracted. By discharging pressurized water around the geoduck, the sediment is loosened and the clam is removed by hand. For the dive harvester, this entire process takes 5 to 10 seconds (Figure 2-20). Each diver carries a mesh bag to collect the harvested geoducks. Divers periodically surface to unload their bags. One diver can harvest 500 to 1,000 geoducks per day. Multiple divers may work in an area at one time. Dive harvesters work no more than 3 to 4 hours per day.
Geoduck harvesting occurs year-round and is not limited by tidal height. However, dive harvesting tends to be the dominant method during winter months (November through February) due to the prevalence of high daytime tides, the absence of suitable low tides for daytime beach harvest, and generally favorable market conditions during that period. Both low-tide and dive harvests may occur on the same sites. It is estimated that the dive harvest is used about 75% of the time compared to the non-dive harvest method (Cheney 2007 referenced in Anchor 2010). Harvest occurs until all harvestable-sized geoduck are removed from the harvest area. Harvesters make several sweeps of a tract to ensure all harvestable-sized geoduck are removed. Because of differences in geoduck growth rates with a mix of harvest-sized and under-sized clams, only a portion of a project area may be harvested, with the remainder set aside for later dive or beach harvest. Additionally, a dive harvest is typically supplemented with beach harvest when clam densities are reduced in the project area. Harvest may also be constrained by tide and current conditions with slow or slack water conditions reducing or restricting the ability to effectively harvest with divers.
32
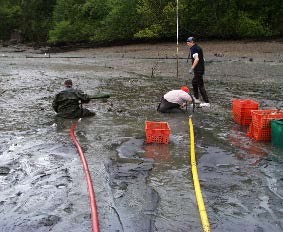

Figure 2-19. Harvesting geoduck at low tide (PCSGA 2011, CPPSH 2015)
Dive harvest is the typical method used for harvesting subtidal geoducks. Dive harvesters work within an approximate 100-foot range from the harvest vessel, or to the maximum lengths of their air and water lines. Intakes for supplying water to the onboard pumps are positioned several feet below the water surface. Intakes will be screened per Conservation Measure.
2.4.5. Vessel and Vehicle Support
Various types of vessels and vehicles could be used to support activities for all shellfish species. Vessels could include offshore rafts, small open crafts with outboard motors, and larger barges (Table 2-1). Land vehicles (e.g., trucks, ATV) could also be used to support the various activities. Use of support vessels would be within the immediate shellfish activity area or the immediate vicinity.
Vessels could be used to mechanically harvest, tow harrow, prepare or maintain the substrate (e.g., graveling). Vehicles may be used on the culture beds as a base of operations and to transport equipment and shellfish. Vehicles can also be used to mechanically harvest or prepare the substrate for harvest (Figure 2-14). This could include tractors harrowing/tilling the substrate.
Geoduck dive harvesters work from small surface vessels or dive platforms that contain machinery for surface-supplied diver air and water jets, diver communication equipment, and on-deck storage for harvested geoducks. Dive boats used to harvest cultivated geoduck may be anchored over the harvest sites and moved to deeper water during low tides. Dive boats used to harvest subtidal geoduck typically move over the harvest area as needed to adjust the divers’ position relative to geoduck density.
Information on vessel sizes have has been provided by PCSGA which is expected to be representative of the range of support vessels that would be used for the various types of activities described above.
33

Figure 2-20. Geoduck dive harvest sequence (Anchor 2010)
34
Table 2-1. Types of support vessels and equipment used while conducting work and activities under NWP 48 and estimated in-air noise (PCSGA 2013b).
|
Equipment |
Purpose |
Estimated dBA |
|
5hp motor with propeller |
FLUPSY |
65@100 yards |
|
10hp engine |
skiffs, water pumps, hatchery intake |
65 @ 100 yards |
|
40-330hp engine |
boat inboard/outboard |
65-90 @ 0.5 m |
|
air compressor |
diving |
77-85 @ 7m |
|
power washer (4000 psi) |
nursery raft/FLUPSY |
<100 @ operator ear (~3 feet) |
|
electric hoist |
lifting nursery raft/FLUPSY |
75-85 @ 50 ft |
|
crane |
lifting nursery raft/FLUPSY |
81 @ 50 ft |
|
harvester (6 cylinder Chevy Vortec engine) |
harvesting clams |
60-90 @ 15 m |
2.4.6. Summary of Activities
The activities are summarized below in Table 2-2. This summary may not necessarily list all the activities described in the previous sections.
Table 2-2. Summary of shellfish activities included within the proposed action.
|
Species |
2017 NWP 48 Work and Activities |
||
|
Mussel
Blue, Gallo |
Seeding/ Planting |
• • |
Raft, floats, and their associated maintenance Set lines or metal screen frames in net cages suspended in water to naturally set seed. |
|
|
• |
Install socks weighted and lashed to rafts, lines, or stakes and suspended in water for hatchery-raised seed. |
|
|
• |
Place buoys or anchors used to mark and secure structures |
||
|
Maintenance / Grow-out |
• • |
Placement/maintenance of predator exclusion nets Replace and maintain stakes and lines |
|
|
• |
Remove biofouling and weights |
||
|
• |
Monitor growth |
||
|
Harvest/ Processing
|
• • |
Strip mussels from the lines or socks Bag mussels for transport |
|
|
• |
Intake or outfall structures (pipes) (discharge compliant with NPDES) to connect upland wet storage holding tanks |
||
|
Oyster
|
Seeding/ Planting |
• • |
Raft, floats, and FLUPSYs and associated maintenance Prepare substrate by removal of debris (rocks/large wood) |
35
|
Species |
2017 NWP 48 Work and Activities |
||
|
Pacific, Olympia, Kumamoto, Eastern, European flat |
• • • • |
Remove/relocate undesired aquatic species Application of gravel/shell to firm substrate (sprayed from vessel, or delivered with land vehicle and mechanically or hand deposited). Mechanically level substrate Use of ‘continuing’ seed floats |
|
|
• |
Use of work floats |
||
|
• |
Use of racks/elevated trays or bins |
||
|
• |
Create oyster hummocks (oyster shell mounds) |
||
|
• |
Install bags of cultch material onto stakes, lines, racks, trays or secured directly onto substrate |
||
|
• |
Suspend lantern nets, bags, cages, vertical ropes or wires from surface longlines, or ‘continuing’ rafts |
||
|
Maintenance / Grow-out |
• • |
Continued removal of debris/aquatic species, as necessary Flip/turn bags |
|
|
• |
Re-position stakes |
||
|
• |
Remove excess biofouling |
||
|
• |
Harrow to lift excess mud or sand/re-level substrate |
||
|
• |
Pull and restack trays |
||
|
Harvest/ Processing |
• • |
Hand harvest into containers for transport Mechanical shallow depth dredging from barges |
|
|
• |
Collection and transport of oysters to ‘fattening’ beds to harden (2nd harvest then occurs) |
||
|
• |
Wet storage (in-water) |
||
|
• |
Use of work platforms |
||
|
• |
Intake or outfall structures (pipes) (discharge compliant with NPDES) to connect upland wet storage holding tanks |
||
|
Clam
Manila, littleneck, butter, eastern soft shell, horse, razor, cockle |
Seeding/ Planting |
• • • • • • |
Raft, floats, and FLUPSYs and associated maintenance Use of seed grow-out trays and bins Prepare substrate by removal of debris (rocks/large wood) Remove/re-locate other aquatic species (starfish, vegetation) Application of gravel/shell to firm substrate (sprayed from vessel, or delivered with land vehicle and mechanically or hand deposited). Placing secured nets on the substrate |
|
• |
Applying seed from vessel/vehicle or from foot |
||
|
• |
Place secured or trenched-in net bags |
||
36
|
Species |
2017 NWP 48 Work and Activities |
||
|
Maintenance / Grow-out |
• • |
Continued removal of debris/aquatic species, as necessary Repositioning/cleaning nets to remove debris/biofouling |
|
|
• |
Turning bags |
||
|
Harvest/ Processing |
• • |
Hand digging/bag removal Mechanical harvest |
|
|
Geoduck
|
Seeding/ Planting |
• • |
Raft, floats, and FLUPSYs and associated maintenance Use of seed grow-out trays and bins |
|
• |
Prepare substrate by removal of debris (rocks/large wood) |
||
|
• |
Remove/re-locate undesired aquatic species |
||
|
• |
Install PVC tubes with individual net covers or flexible net tubes |
||
|
• |
Install secured area net covers |
||
|
• |
Install secured net tunnels |
||
|
Maintenance / Grow-out |
• • |
Clean tubes to remove debris/biofouling Remove tubes/nets (area nets may be reset after tubes removed) |
|
|
Harvest/ Processing |
• • |
Harvest by hand (low tide, high tide, and subtidal by divers) Use of pressured water to liquefy substrate |
|
|
All species |
|
• |
Use of work platforms |
|
• |
Vessel support (grounding/anchoring) |
||
|
• |
Land vehicle/foot support to and from uplands to transport equipment, material, shellfish, and people |
2.4.7. Activities Specifically Excluded
Certain shellfish activities (Table 2-3) are excluded from the proposed action for various reasons including:
- Activity extends sufficiently beyond the jurisdiction of the Corps regulatory program and/or is regulated by another Federal agency (e.g., upland hatcheries, NPDES discharge, pesticide use).
- Any unauthorized activity (e.g., not permitted) is not included in the action.
Table 2-3. List of NWP 48 excluded work and activities
|
Excluded Work and Activities |
|
Vertical fencing/vertical nets or drift fences (includes oyster corrals; does not apply to raft nets) |
37
|
New berms or dikes or the expansion or maintenance of current, authorized berms or dikes |
|
Pile driving |
|
Installation and maintenance of mooring buoys |
|
Construction, maintenance, and operation of upland hatcheries |
|
Cultivation of invasive species |
|
Construction, maintenance, and operation of attendant features, such as docks, piers, boat ramps, stockpiles, or staging areas |
|
Deposition of shell material back into waters of the United States as waste |
|
Dredging or creating channels (e.g., placing sand bags) so as to redirect fresh water flow |
|
Any form of chemical application to control undesired species (e.g., non-native eelgrass Zostera japonica, burrowing shrimp) |
|
The use of materials that lack structural integrity in the marine environment (e.g. plastic children’s wading pools, unencapsulated Styrofoam®). |
|
Unauthorized activities |
38
2.5. Geographic area
The geographic area of the action is the nearshore coastal and inland marine waters of Washington
State. This includes Washington coastal beaches, coastal embayments (e.g. Willapa Bay and Grays Harbor), the Strait of Juan de Fuca, and the Puget Sound/Salish Sea (see Figure 1). Work is only expected to occur in the shallow nearshore marine and brackish waters. No work is anticipated in freshwater. Negligible use of NWP 48 is expected in the Columbia River and along the Washington coastal beaches due to the lack of historical shellfish aquaculture in these locations, and the anticipated continued lack of aquaculture in the future. Since work under NWP 48 is not anticipated in the Columbia River estuary, coastal beaches, or in freshwater or upland areas, these geographic areas are not analyzed or discussed in the context of cumulative effects.
39
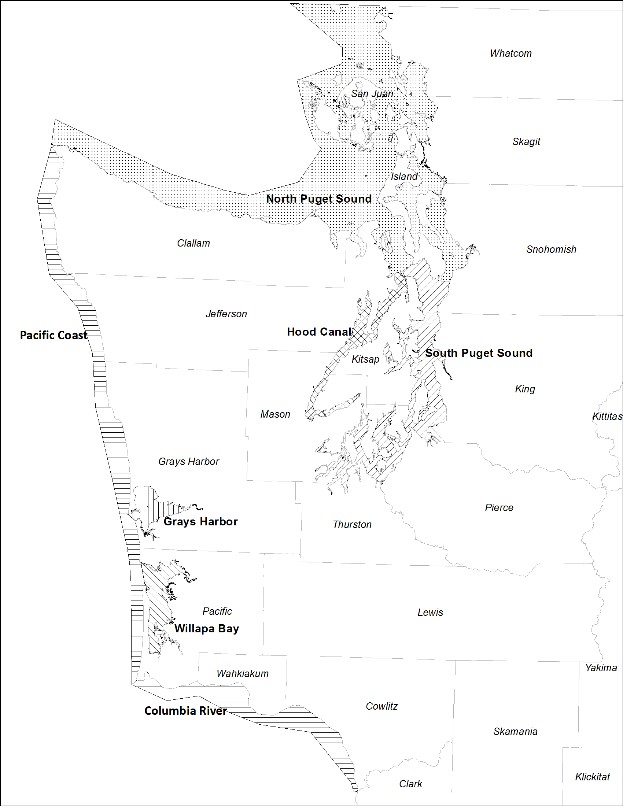
Figure 2-21. Geographic area and sub-regions of action
40
2.5.1. Acreage
The 2017 NWP 48 authorizes project areas for shellfish aquaculture. In the state of Washington project areas can be privately owned real estate parcels with the area delineated by a deed or a leased area that is delineated by the lease. A project area need not necessarily be entirely engaged in aquaculture but may include active culture areas, fallow areas, or areas that have never or will never be engaged in aquaculture. Project areas can be either continuing/ongoing if there has been aquaculture somewhere within the project area during the last 100 years or a project area can be new to aquaculture. Table 2-5 summarizes the anticipated total acreage that will be permitted under 2017 NWP 48 for continuing and new project areas by geographic area. This includes all project area acreage that was permitted under 2012 NWP 48 which is expected to be reauthorized under 2017 NWP 48 and anticipated new project area acreage. Continuing acreage includes all acreage that has been permitted to date under the 2012 NWP 48 and all known pending acreage. Since not all permit applications for 2012 NWP 48 have been received and some pending applications have not identified acreage, not all continuing acreage is known. The continuing acreage in Table 2-5 was therefore rounded up to account for this unknown acreage.
In order to determine the scale of shellfish activity conducted under the proposed action, the Corps developed an estimate for the total project area acreage that is expected to be authorized by 2017 NWP
48. Estimates for the amount of acreage that could be authorized under the proposed action are provided by geographic region.
The acreage estimates are based on many factors including historical Corps permit applications, estimates provided by commercial shellfish growers for future aquaculture production, coordination with the Washington Department of Natural Resources (WDNR) and their potential shellfish activities, and the general knowledge and expertise of the Corps professional staff that have processed shellfish related permit applications.
For the purpose of categorizing acreages, the activities have been subdivided into floating culture (i.e., with floating lines or rafts) and ground-based culture which includes all other activities including oyster longline culture. Based on analysis of permit applications, there are a total of 934 ongoing/existing project areas. Of these, a total of 927 include ground-based activities conducted in the intertidal or adjacent shallow subtidal areas. The remaining seven activity footprints are for floating culture with rafts exclusively. Five of the continuing activities include both raft and ground-based culture.
Floating aquaculture
Analysis of historical permit applications indicates that floating aquaculture activities occur in Willapa Bay, Hood Canal, South Puget Sound and North Puget Sound. There are a total of twelve continuing active footprints with rafts that cover 87 acres. It is estimated that an additional 100 acres of new floating acreage could be authorized under the 2017 NWP 48. New surface or floating longlines would be authorized under the proposed action. There are a total of 22 continuing active and 32 continuing fallow acres with surface longlines. New floating acres are estimates based on coordination with the shellfish industry and Corps professional judgment.
41
Ground-based aquaculture
Ground-based commercial aquaculture encompasses all of the activities discussed in Section 2 except for the floating activities using rafts. The anticipated acreage for these activities includes both continuing and new activities (Error! Reference source not found.). The acreage for the continuing activities was collected from permit applications that are maintained by the Corps. The geographic locations for each of the continuing activity footprints are illustrated in Appendix D.
The total acreage for new activities is estimated based on projections provided to the Corps by the aquaculture industry, the historical rate of permit applications, and the experience of Corps professional staff.
The vast majority of the ground-based commercial aquaculture and all new activities would occur at tidal elevations between – 4.5 ft and +7 ft MLLW. It is probable that some percentage of this total acreage would be authorized (or reauthorized) at subtidal elevations (i.e., deeper than – 4.5 ft MLLW). This would typically be shallow subtidal lands immediately adjacent to intertidal shellfish activity areas. Based on an analysis of historical permit applications, 22 acres of subtidal lands were previously authorized as continuing shellfish activities. Because permit applicants have not historically been required to delineate their project footprints by tidal elevation, this total likely underestimates the subtidal acreage of continuing shellfish activity. This conclusion is supported by Corps professional staff knowledge of many of the continuing shellfish activity areas. Analysis of aquatic parcel maps and the Corps geographic database also indicates that greater than 22 acres of subtidal lands have likely been previously authorized. WDNR has indicated all but 1,085 acres of marine bedlands (i.e., deeper than extreme low tide) in the State of Washington are owned by WDNR, and WDNR does not lease these lands for ground-based aquaculture currently (WDNR 2013a). WDNR does lease subtidal lands for floating raft aquaculture activities. Because public subtidal lands would not be used for ground-based aquaculture, these 1,085 acres would be considered the maximum amount of subtidal acreage available for ground-based commercial aquaculture. This would constitute less than 3% of the total continuing commercial acreage. These unknown subtidal acres are included in the totals for ground-based activities.
The vast majority of acreage for commercial aquaculture is for activities that are ongoing. Since these activities represent the majority of all shellfish activity potentially authorized under the proposed action, an evaluation of this information is useful for understanding the action and its effects. It is anticipated that all of the ongoing activities would be reauthorized by the Corps under the 2017 NWP 48. A detailed summary of the shellfish activities proposed by historical permit applicants can be found in Appendix B. A summary of the species cultivated by ground based methods can be found in Table 2-4. The table does not include a small amount of mussel bottom culture. The predominant species cultured varies by geographic region. On an acreage basis, the most commonly cultured species appears to be oyster followed by non-geoduck clams.
42
Table 2-4. Distribution of ground-based commercial aquaculture continuing footprints and acreage by species cultivated
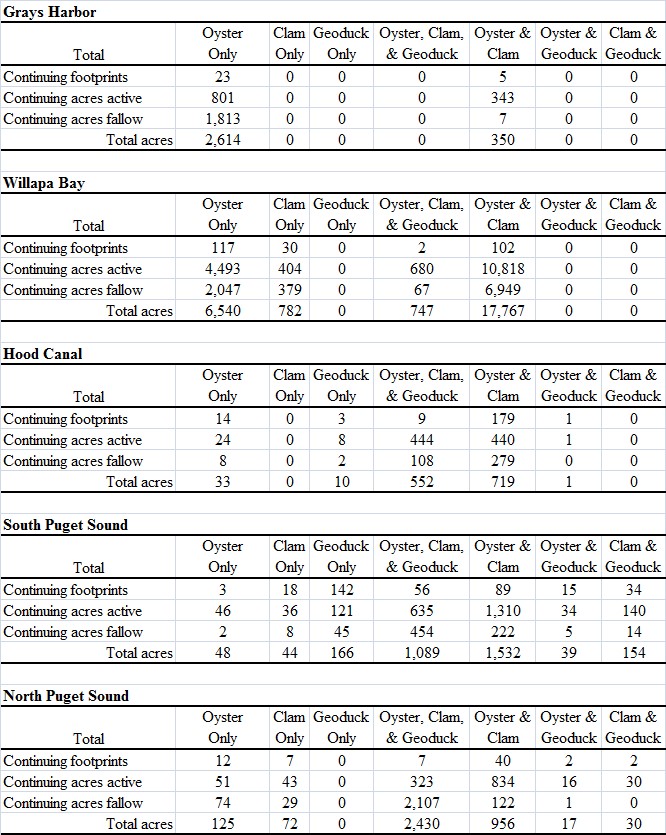
43
Summary of NWP 48 acreage
The total potential commercial aquaculture acreage that would be authorized by geographic region is illustrated in Table 2-5.
Table 2-5. Total acreage by project area authorized under 2017 NWP 48 (2017 to 2022)
|
Project area acreage |
Grays Harbor |
Willapa Bay |
Hood Canal |
South Puget Sound |
North Puget Sound |
Total |
|
Continuing/ongoing |
3,846 |
36,315 |
1,820 |
3,648 |
3,946 |
49,576 |
|
New |
24 |
19 |
105 |
106 |
78 |
332 |
|
Total (estimated) |
4,000 |
40,000 |
2,000 |
4,000 |
5,000 |
55,000 |
Many project areas include fallow acreage or acreage that has never been engaged in aquaculture. This acreage is summarized in Table 2-6. For the purpose of this analysis it is assumed this acreage will be put into aquaculture because it will be authorized for that purpose. In this respect it is similar to a new project area but is not encumbered by the restrictions that come with a new project area (e.g., maximum of ½ acre aquatic vegetation impact).
Table 2-6. Existing project area acreage that is known to be fallow (as of 2012) or was never engaged in aquaculture.
|
|
Grays Harbor |
Willapa Bay |
Hood Canal |
South Puget Sound |
North Puget Sound |
Total |
|
Fallow |
1,820 |
9,441 |
410 |
787 |
2,333 |
14,792 |
|
Never in culture |
333 |
272 |
53 |
326 |
280 |
1,265 |
Oyster culture methods vary by region. The ground culture method is by far the dominant method used for clams in all regions. A summary of primary culture methods and an estimate for the relative distribution of species cultured by region is illustrated in Table 2-7. The estimate is based on the information in Appendix B and Table 2-4.
This estimate is consistent with the PCSGA estimate of 300 acres currently used for geoduck culture in the Puget Sound and Hood Canal regions (PCSGA 2013a).
In order to evaluate effects of the action, the acreage for specific categories of activities and their geographic locations are described. This includes discussion of the prevalence of the various culture methods.
44
Table 2-7. Distribution of species cultivated and primary cultivation methods

2.6. Indirect Activities
2.6.1. Vessel and Vehicle Traffic
Vessel (boat/barge), vehicle (e.g., trucks, ATV), or foot traffic related to the transportation of people and materials to and from activity areas occurs in many, if not all, cases. Vessels could land on the shoreline and load or unload items to waiting vehicles or to individual persons who could then carry these items to an upland destination. Vehicle traffic could occur to and from shellfish activity areas directly along shorelines without any dock or pier. Vehicles could be traveling directly on the substrate (i.e., mudflats) to a proximate upland destination. The distinction between the interdependent vessel and vehicle traffic and the support activity described in Section 2.4.5 is the proximity to the shellfish activity area. In most cases, vessel traffic is anticipated to occur from the shellfish activity areas to a local pier, dock, or to the shoreline directly such as to a local beach. In some cases vessel traffic could occur from activity areas to a more distant destination (e.g., to deliver product to market).
45
2.6.2. Upland Storage Sites
Upland locations used for storing equipment, materials (e.g., shell), or maintaining live product in tanks (e.g., wet storage) could occur in close proximity to shellfish activity areas. These upland locations are in many cases interdependent with the shellfish activity area. The use and management of upland storage locations in close proximity to shellfish activity areas are considered to be interdependent with the proposed action. Disturbance (e.g., of native riparian vegetation) in such upland areas shall be minimized consistent with the Conservation Measures.
2.6.3. Shore Facilities
Shore facilities such as hatcheries and processing plants are typically used in coordination shellfish activities but are not regulated by the Corps.
2.6.4. Pesticide Application
The application of the pesticide carbaryl to aquatic lands in Willapa Bay and Grays Harbor has occurred since the 1960s to control burrowing shrimp species (ghost shrimp Neotrypaea californiensis and mud shrimp Upogebia pugettensis). Pesticide use is not universal to all applicants. It is dependent on environmental conditions and other factors associated with individual project areas and applicants. Pesticides are regulated under section 402 of the CWA which is administered by the Washington State Department of Ecology with EPA oversight. In recent years this activity has received significant scrutiny due to its environmental effects. In 2015 WDOE approved the application of Imidacloprid on 2000 acres in Willapa Bay and Grays Harbor. The applicants subsequently requested WDOE cancel the permit in response to public concerns. A new permit application was received by WDOE in 2016 to apply imidacloprid, a neonicotinoid pesticide, on 485 acres in Willapa Bay and 15 acres in Grays Harbor. The earliest this work could occur is 2018. No pesticides would be applied in 2017. WDOE has preliminarily determined that the proposal will have significant adverse environmental impacts under the State Environmental Policy Act. At this time it is uncertain whether the application will be approved (Rockett 2017 pers comm).
46
3. Effects of the Action
Aquaculture consists of a collection of individual activities that each have their own effects. These effects may be relatively short-term or longer lasting. The effects of these individual activities are discussed below. Of equal or more relevance to ESA listed species are the effects of the collective activities, their frequency, duration, timing, geographic location, and general scale across the landscape.
The frequency and geographic scale of the activities are discussed Section 3.2.
3.1. Effects of Individual Activities
The effects described below are written from the perspective of a worst-case effects scenario relative to issues such as work timing and husbandry practices. The purpose of this approach is to ensure the full range of possible effects is discussed. A brief summary of these effects is provided in Table 3-1 for the culture methods and many of the individual activities.
3.1.1. Water Quality
Bivalves themselves remove phytoplankton and suspended particles from the water column. High densities of bivalves that occur with aquaculture can locally decrease phytoplankton, nutrients, and suspended material increasing water clarity (WDNR 2014b; Straus et al. 2013; Heffernan 1999; Newel 2004). Wastes from the cultured species are excreted into the water column and ultimately settle to nearby sediments.
Many of the shellfish activities (e.g., dredging, dive harvest) physically disturb the substrate which results in localized turbidity, increases in suspended sediment, and potentially changes in other water quality parameters such as lower dissolved oxygen (Mercaldo-Allen and Goldberg 2011, Heffernan 1999). These water quality effects may be delayed for activities conducted at low tide ‘in the dry’ until the tide floods the area. There may be a turbidity plume emanating from the actively worked area at low tide for some activities such as intertidal geoduck harvest. In-water activities such as dredging and dive harvest may affect water quality during the period of activity and a short period afterwards. These effects on water quality are temporary and not expected to persist longer than a period of hours or days (Mercaldo-Allen and Goldberg 2011).
3.1.2. Substrate and Sediments
Physical disturbance of the substrate can occur as a result of anchors placed for rafts or surface longlines, from bed preparation activities (e.g., tilling, harrowing, substrate leveling), planting activities (e.g., installation of nets), harvest (e.g., raking, dredge, hydraulic harvest), the grounding of vessels and support structures, and the general traffic of personnel and equipment. Sediment compaction can occur from vessel grounding, vehicle and personnel traffic. Topographic variation and natural debris such as large wood and boulders are often removed. In some cases this can result in filling of tidal channels in order to level a bed. Bed preparation techniques vary widely as do their effects depending on the specific cultured species and individual grower practices. Bed preparation and harvest activities such as dredging, tilling, raking, and hydraulic harvest result in turning over the sediments may temporarily alter the physical composition and chemistry of the sediment (Mercaldo-Allen and Goldberg
47
2011, Bendell-Young 2006, WDNR 2014b). Hydraulic harvest in geoduck culture areas results in liquefaction of the substrate.
Subtidal geoduck harvest temporarily leaves behind a series of depressions, or holes where the clams are extracted. The number of depressions created across a harvested area in a tract depends on the density of geoducks. The fate of these depressions, in terms of the time to refill, depends on the substrate composition and tidal currents. The time for them to refill can range from several days up to 7 months (Goodwin 1978).
Many activities result in a change to the composition of the native substrate which is often mud or sandflats. Graveling results in a generally firmer substrate with a larger grain size. Oyster bottom culture results in a substrate that is predominantly or entirely oysters that are periodically removed during harvest. Longline and stake culture result in an altered substrate that is partially shaded/occupied by oysters and stakes. Culture techniques that use racks, bags, nets, and PVC tubes result in an altered substrate that is intermittently or more broadly surfaced with plastic. There can be wide variability in the coverage of the plastic structure across the substrate depending on the practices of individual growers. Bag culture could be sufficiently dense to completely cover an existing substrate over a relatively broad area (Figure 2-9). Similarly plastic nets placed for clam or geoduck culture could extend over multiple acres (Figure 2-17). Alternatively, structures may be placed in rows that result in alternating plastic versus native substrate (Figure 2-10, Figure 2-18). Where the profile of the artificial structure is low, for example with bags resting on the substrate or area nets, sediment may gradually accumulate on top of the structure resulting in a return, at least in part, to a substrate similar to what existed before the activities were initiated. Periodic maintenance of the nets may remove this accumulated sediment. The artificial structure can be present for multiple years in a particular location (e.g., geoduck tubes) or can remain almost continuously over time as new crops are quickly planted after harvest (e.g., clam bags, area nets for clam culture).
Activities that involve placement of structure such as rafts, floating longlines, oyster longline, and rack and bag culture can affect water currents and circulation patterns, can lead to changes in rates of erosion and sedimentation, and altered tidal channels (WDNR 2014b, Wisehart 2007). An evaluation of aerial photographs indicates that tidal channels are generally less prevalent in aquaculture areas which may be due to gradual filling and/or grading that occurs as part of the work. Sedimentation and nutrient enrichment may occur from the settling of wastes to the substrate from the cultured species (Heffernan
1999, WDNR 2013a). Culture using rafts and longlines in particular often experience nutrient enrichment of the local sediments due to accumulation of biological waste and shell material from the cultured species. Anoxic sediments from nutrient enrichment have been documented below rafts (Hargrave et al. 2008; Heffernan 1999). Man-made debris such as metal and plastic can also accumulate beneath rafts.
3.1.3. Vegetation
Aquaculture activities classified as continuing active and fallow would occur in areas containing eelgrass. New project areas could disturb as much as ½ acre of submerged vegetation.
Effects on aquatic vegetation can occur where shellfish activities are co-located with aquatic vegetation including eelgrass and kelp. Rafts shade the underlying substrate limiting the growth of aquatic
48
vegetation. They are typically sited in waters too deep for eelgrass. Macroalgae such as kelp could be negatively affected or excluded from areas beneath rafts (WDNR 2014b). Floating culture using lines suspended from buoys would typically have a smaller footprint than a raft so substrate shading may be limited depending on spacing of the lines.
Ground-based culture activities are often conducted in the same tidal zone occupied by eelgrass. In Puget Sound, WDNR inventoried eelgrass (Z. marina) at a minimum elevation of -41 ft MLLW at a site in central Puget Sound and a maximum elevation of +7.5 ft MLLW at a site in Hood Canal (WDNR 2011). The average minimum and maximum elevations throughout Puget Sound were +0.3 to +3.0 ft MLLW. This range encompasses the elevations where ground-based shellfish activities would occur. When shellfish activities are co-located in areas with eelgrass, a net loss in eelgrass is typically the result either as a result of bed preparation activities, competition for space with the culture species or equipment, or harvest (Tallis et al. 2009, Wagner et al. 2012, Wisehart 2007; Dumbauld et al. 2009, Ruisink et al. 2012, NMFS 2009, NMFS 2005, Rumrill and Poulton 2004). This is the case for all forms of ground-based culture. Eelgrass is replaced by oysters, culture bags, and geoduck tubes. Eelgrass often coexists within the culture area albeit at a reduced density. Bed preparation and harvest activities physically remove eelgrass (Ruesink and Rowell 2012; Tallis et al. 2009; Boese 2002, Simenstad and Fresh 1995). Use of vessels and floats can smother and cause physical disturbance to eelgrass due to grounding of the vessels (NMFS 2005). Longline and suspended bag culture may shade eelgrass and preclude it underneath the structure (Skinner et al. 2014; WDNR 2014b). Biofouling on cover nets can reduce light availability for eelgrass (WDNR 2013a). The magnitude and duration of effect may vary depending on culture method and individual grower practices. For example, dense, mature bottom oyster culture may totally preclude eelgrass during certain parts of the aquaculture cycle while lesser densities of oyster may allow eelgrass to coexist within the culture area.
Eelgrass recovery times after disturbance vary depending on the type of disturbance, environmental conditions, and the availability of local seed sources. Timeframes can range from less than two to greater than five years (Dumbauld et al. 2009; Tallis et al. 2009; Wisehart; 2007, Boese 2002).
3.1.4. Benthic Community
Most shellfish activities affect the existing benthic community to some degree due to the physical disturbance of the substrate. Each phase of the aquaculture cycle of activity which is characterized by bed preparation (e.g., tilling), planting (e.g., net installation), maintenance (e.g., cleaning area nets), and harvest results in physical disturbance of the benthic community and often a temporary decrease in abundance of many infaunal and epifaunal species (Vanblaricom et al. 2015; Mercaldo-Allen and Goldberg 2011; WDNR 2014b; Straus et al. 2013; Dumbauld 2008; Heffernan 1999; Bendell-Young 2006; Simenstad and Fresh 1995). Bed preparation activities often directly remove many species including bivalve predator species, bivalve competitor species, and commercial species such as bivalves/burrowing shrimp. Bag culture techniques result in bags with bivalves placed directly on the substrate smothering the existing benthic community. The magnitude and duration of the effect is variable depending on the activity, individual husbandry practices, and environmental conditions. The benthic community typically recovers in a period of weeks or months depending on the activity (Vanblaricom et al. 2015; WDNR 2014b; Mercaldo-Allen and Goldberg 2011; WDNR 2008).
49
Benthic community diversity and/or composition may be altered as a result of physical changes to the substrate depending on the specific culture method and activity. Oyster bottom culture results in a shift in the composition of the benthic community to an oyster dominated community. This may have positive, negative or neutral effects on individual species. Areas with mature oyster bottom culture may have a comparable level of species diversity and abundance to an eelgrass based habitat (Ferraro and Cole 2007). Once oysters are harvested, the benthic community may begin transition back to the preoyster based community that existed previously. Regular graveling can result in shifts in the composition of the benthic community due to the change in substrate composition over time (Simenstad and Fresh 1995, Simenstad et al. 1991). When activities result in removal of eelgrass, a corresponding change in the benthic community occurs (Carvalho et al. 2006, Simenstad and Fresh 1995). Changes in sediment chemistry from nutrient enrichment can result in decreased benthic community abundance and diversity for some culture methods (Heffernan 1999; Stenton-Dozey 2001). Shifts in benthic community composition diversity are less clear for other culture methods and the subject of active study. Chemical changes to the benthic habitat can also occur as a result of aquaculture, particularly under floating rafts, where nutrients and aquaculture debris can accumulate.
Activities that include installation of artificial structure such as geoduck tubes, nets, bags, or longlines may result in shifts in benthic macrofauna. In a study of geoduck tubes, increased numbers of transient fish and macro invertebrate species were found when the structure was in place (McDonald et al. 2015). Effects ended when the structure was removed. Tubes and nets are typically in place for 2 to 3 years before harvest at 4 to 7 years. A study of rack and bag culture also suggested habitat benefits of the structure to certain fish and invertebrate species (Dealteris et al. 2004). Studies with area nets have been variable with no changes in species composition and diversity in some cases (Vanblaricom et al. 2015; Simenstad et al. 1993) and altered species diversity and composition measured in others (BendellYoung 2006).
3.1.5. Fish and Birds
In-water activity, noise, and increases in suspended sediment would displace many fish species and birds from localized work areas. Temporary decreases in benthic community abundance would locally decrease available prey for fish. Eelgrass provides important habitat and prey for many fish and bird species including juvenile salmon. In areas where eelgrass is removed, the fish community may be negatively affected (NMFS 2005).
Forage fish are an important prey resource for many species including Chinook salmon, steelhead, bull trout and marbled murrelet. Several forage fish including Pacific herring, surf smelt, and Pacific sand lance spawn throughout the action area. Spawning and egg incubation could potentially be affected by shellfish activities. In the Puget Sound region, herring spawn in the lower half of the intertidal or shallow subtidal zone down to a depth of -10 ft MLLW depending on water clarity (Penttila 2007). Native eelgrass, Z. marina, is of primary importance as a herring spawning substrate. Spawning also occurs on other aquatic vegetation and rocks. The removal of vegetation, which may occur as a result of some of the shellfish activities could decrease available spawning habitat for herring. Spawning has occurred on shellfish gear such as racks or tubes (Pentilla 2007). Work in areas with spawn may kill the eggs.
50
Sand lance deposit their eggs in substrate that is predominantly sand in the high intertidal above +5 ft
MLLW. Surf smelt tend to spawn in substrates with a mix of sand and gravel above +7 ft MLLW (Penttila 2007). Shellfish activities conducted when spawning is occurring or after eggs have been deposited could potentially disturb these species or destroy eggs. Culture and harvest activities would not typically occur above +7 ft MLLW but would occur below that elevation in the zone where sand lance may deposit eggs. Above +7 ft, shellfish activities would still occur including general travel to and from shellfish activity areas, temporary storage/staging of equipment, and grounding of floats which all could result in trampling, smothering, or loss of eggs.
Area nets used for clam and geoduck culture could potentially entrap fish, birds, or other aquatic species if they become loose or dislodged (Bendell 2015, Corps 2014b, Smith et al. 2006). This could occur due to variable husbandry practices with respect to net installation and maintenance, the high energy of the marine environment which makes securing nets difficult, and large wood debris strikes that create holes in the nets. Rack and/or bag culture could also entrap fish species by creating a physical barrier across the tidelands (Figure 2-10). This barrier could temporarily impound water and/or prevent fish from returning to deeper water during a receding tide which would result in stranding fish on the tidelands. The density and orientation of the structure relative to water drainage patterns would be particularly important in determining the risk of this occurring. Finally, nets associated with floating rafts would exclude fish from habitat under the rafts. Net deployment may occasionally capture fish depending on the depth of the nets.
3.1.6. Contaminants
The use of vessels and vehicles could result in accidental discharges of fuel, lubricants, and hydraulic fluids. The effect on water quality depends on the type of contaminant spilled, time of year, spill volume, and success of containment efforts.
Plastic debris such as nets and tubes may break free from project sites and be released to the environment. These materials eventually breakdown in the environment into small plastic particles called microplastics which can be ingested by organisms and accumulate up the food web (Wright et al 2013). Microplastics have been found in numerous species including fish and shellfish species and documented to have adverse effects (Lönnstedt and Eklöv 2016). Microplastics have been found in Puget Sound (Davis and Murphy 2015). It is uncertain to what degree aquaculture contributes to this debris.
3.1.7. Noise
Noise from equipment operation could temporarily disturb and displace both aquatic and upland species from the local area. The types of vessels commonly used for shellfish activities are listed in Table 2-1. To estimate noise produced by shellfish activities, an analysis was conducted using data from Wyatt (2008) for a commonly used vessel, a 21-foot Boston Whaler with a 250 horsepower Johnson 2-cycle outboard motor. Operating this vessel at full speed produced a sound measured at 147.2 decibels (dB) root mean square (RMS) re 1 microPascal at 1 meter[1]. Assuming a background underwater sound level
51
of 120 dB RMS, which is the threshold established by NMFS for behavioral effects to marine mammals, and using the practical spreading loss model preferred by NMFS and USFWS, sound produced by this vessel would attenuate to 120 dB RMS within 65 meters (213 feet). Larger vessels could also be used on occasion which could potentially generate greater underwater sound levels.
The intermittent use of power equipment is likely to produce in air noise of up to 81 dBA for dive harvesting and 82 dBA for shoreline work. Over marine water, the 81 dBA value would attenuate to the background level (57 dBA) within 792 feet and over a terrestrial habitat the 82 dBA would attenuate to the background noise level of a rural environment (35 dBA) within 3793 feet (0.71 mile). Maximum surface noise levels from boat operations and dive support equipment for subtidal geoduck harvest was measured at 61 to 58 dBA at a distance of 100 feet where auxiliary equipment was housed on deck and 55 to 53 dBA where equipment was housed below deck (WDNR 2008).
3.1.8. Summary
Effects of the various shellfish activities on habitat are summarized in Table 3-1. It is a summary of worst-case effects that would not necessarily occur in all locations where the activity is occurring.
Substantial local variability would be expected due to individual grower practices (e.g., densities, scale, techniques) and environmental conditions.
Table 3-1. Summary of shellfish activity effects on habitat
|
Shellfish Activity |
Cultured/ Harvested Species |
Primary Effects on Habitat |
|
floating culture |
and harvest |
methods |
|
floating culture with rafts, antipredator nets |
mussel |
|
|
surface longlines |
mussel, oyster, clam |
• limited shading of substrate, minor effects on aquatic vegetation |
|
FLUPSYs |
oyster, clam, geoduck |
• shades substrate preventing or limiting growth of aquatic vegetation |
|
ground-based c |
ulture and har |
vest methods |
|
oyster bottom culture |
oyster |
• altered benthic habitat and species composition • aquatic vegetation replaced by oyster habitat |
|
longline, stake culture |
oyster |
|
52
|
Shellfish Activity |
Cultured/ Harvested Species |
Primary Effects on Habitat |
|
rack and bag culture |
oyster |
|
|
clam ground culture |
clam |
|
|
bag culture (bags directly on substrate) |
clam, oyster |
|
|
geoduck culture |
geoduck |
|
|
low tide activiti install and maintenance of area nets |
es clam, geoduck |
|
|
‘hand’ harvest (rakes, shovels, containers) |
clam, oyster |
|
|
bed preparation (mechanized tilling, leveling substrate, hydraulic preharvest) |
oyster, clam, geoduck |
|
|
low tide hydraulic harvest |
geoduck |
|
|
longline harvest |
oyster |
|
|
vehicle and vessel traffic on tidelands |
oyster, clam, geoduck, mussel |
|
|
temporary equipment storage on tidelands; use |
oyster, clam, geoduck, mussel |
|
53
|
Shellfish Activity |
Cultured/ Harvested Species |
Primary Effects on Habitat |
|
of floats, work platforms |
||
|
in-water activiti |
es |
|
|
dredging, harrowing, longline harvest |
oyster, clam |
|
|
graveling |
oyster, clam |
|
|
hydraulic dive harvest |
geoduck |
|
3.2. Spatial Extent and Frequency of Effects
The following section discusses the scale and frequency of activities and effects resulting from the proposed action.
3.2.1. Extent of Floating Activities
Floating aquaculture occurs in all of the geographic regions except for Grays Harbor. In all cases the acreages involved are negligible in the context of each region. Activities are concentrated in a few embayments (e.g., Quilcene Bay, Penn Cove) where the acreage covers a larger percent of the embayment area (see figures in Appendix D). Effects would be limited to the immediate proximity of the work areas and would continue for the duration of the permit authorization and likely beyond.
3.2.2. Extent of Tideland Activities
The vast majority of the ground-based continuing active and fallow/new activities would occur in the intertidal zone as would all of the new aquaculture, restoration, and recreation activities. An unknown but likely insignificant percentage of the ground-based continuing aquaculture activities (both active and fallow) would occur in the shallow subtidal zone. For these reasons and to simplify the analysis, the entire ground-based acreage is considered intertidal. The percentage of the total intertidal acreage that would be devoted to shellfish activities within each geographic region is summarized in Table 3-2. The total tideland acres are based on the area classified as marine tideland in the Washington State aquatic parcel GIS database (WDNR 2014a). Marine tidelands extend from ordinary high tide down to extreme
54
low tide (WDNR 2013a). This analysis indicates proportionally how much of the intertidal habitat would be affected by the proposed action.
Table 3-2. Project area acreage relative to total tideland acreage

For all regions combined, the continuing fallow and new shellfish activity would occur on 8% of the combined tidelands. This varies between a low of 3% in South Puget Sound to a high of 19% in Willapa Bay. Continuing active aquaculture activities occur on 10% of the combined tidelands across all the regions although there is quite a bit of variability ranging from a low of 2% in North Puget Sound to a high of 33% in Willapa Bay. The cumulative total percentage of tidelands with some form of shellfish activity is 18% across all the regions. This coarse scale analysis illustrates the geographic magnitude of the action. Comparatively higher percentages of tidelands may be affected in individual embayments within each region. For example, in South Puget Sound, shellfish activities are concentrated in the far south and west corner of the region (see Appendix D). In north Puget Sound, shellfish activities are concentrated in several smaller embayments including Samish Bay, Discovery Bay, and Kilisut Harbor.
The acreages classified as fallow and new contain relatively undisturbed habitat currently. The action would result in a change from this undisturbed habitat to an aquaculture farm. Activities with effects similar to those described in Section 3.1 would occur on this acreage over the period of the permit authorization.
3.2.3. Frequency of Disturbance
Some of the proposed shellfish activities may only be conducted once in that footprint over the anticipated 5 year period of the permit authorization and thus would have a very limited period of effects. In other cases, multiple activities may occur on a given footprint annually or potentially more
55
frequently. For example active maintenance of cover nets for clams could occur monthly. Active oyster bottom culture on a given footprint could include two successive dredges, harrowing, and graveling each year. The frequency of activities on most acreage would fall somewhere in between these extremes. The variability in activity frequency among shellfish growers is also high. Table 3-3 lists frequencies of occurrence for a number of the activities. The information was gathered from individuals engaged in aquaculture in the State of Washington (Corps 2014a, Corps 2011).
Table 3-3. Shellfish activity frequency of occurrence and acres completed per day

Note: This information does not necessarily encompass the full range of activity rates and frequencies for the activities. There is wide variability. The information is considered representative but is based on a limited sampling of aquaculture growers (sources Corps 2014a, Corps 2011).
For some areas, particularly larger aquaculture acreages, there is a progression of activity from one end of the acreage to the other that may occur over a series of days, weeks, or longer. Certain effects, such as increases in suspended sediment, from one part of the acreage may drift over locations where the activity had previously been completed thereby extending the duration of effects in that location. This is most applicable to those activities that take comparatively longer to conduct (see Table 3-3). For example, harvest of cultured geoduck is a comparatively time consuming activity that could occur for months at a particular location as it slowly progresses across the acreage.
Most of the activities occur at a frequency of only once every year, or once every few years on given acreage. In the context of the temporary impacts that occur with the activities, the relevance of this frequency is dependent on recovery from the impact. Effects that diminish quickly such as increases in suspended sediment are minor in the context of a once per year frequency. The collective activities conducted on a particular acreage may increase this to 3 or 4 times per year. Collectively the total period of effects is still minor and on the order of days. For impacts that require a slightly longer period for recovery such as the benthic community (weeks to months) following bed preparation or harvest activities, the period for effects would be comparatively longer. For impacts where recovery times are on the order of years, such as disturbance to eelgrass, an annual or every few year repeat disturbance
56
may never allow a full recovery of the eelgrass from the impact or the impact would be repeated shortly after recovery is achieved.
In-water Disturbance
Activities conducted in-water include graveling, harrowing, dredging, mechanical longline harvest, and geoduck dive harvest where there is potential to directly affect fish species. To determine the frequency and extent of these in-water activities at a regional scale, estimates were made for the total acres per day worked and total activity days for each region. ‘Acres worked per day’ is an estimate of the number of acres that would be worked every day for one year to complete the tasks in one year. The analysis assumes the activity effort is equally spread across the entire year which may be unrealistic but does provide some indication of the relative scale of the collective activity level. ‘Activity days per year’ is an estimate of the number of days that are required to be worked in order to complete the task on the activity acres during one year. It is analogous to ‘man-days’. More detail including the methodology used to develop the estimates can be found in Appendix C. The locations of the specific in-water activities can be found in Appendix F. This analysis is for work that occurs in the intertidal zone, so it does not include subtidal geoduck dive harvest.
The analysis suggests work is regularly occurring, perhaps on a daily basis, at the regional scale. This is consistent with the idea that shellfish product must be delivered to market on a regular and perhaps daily basis. Willapa Bay is by far the region with the most work occurring. There are an estimated 139 acres that would be worked each work day to accomplish all the tasks in one year. Relative to the total tideland acreage per region, the acres worked per day estimate is negligible (0.3 % in Willapa Bay). If assume work only occurs once per month, this increases to 6% of the tidelands worked in Willapa Bay on that one day per month. In some small embayments where shellfish activities are more concentrated, this percentage of activity relative to the total tidelands in that one embayment would be higher.
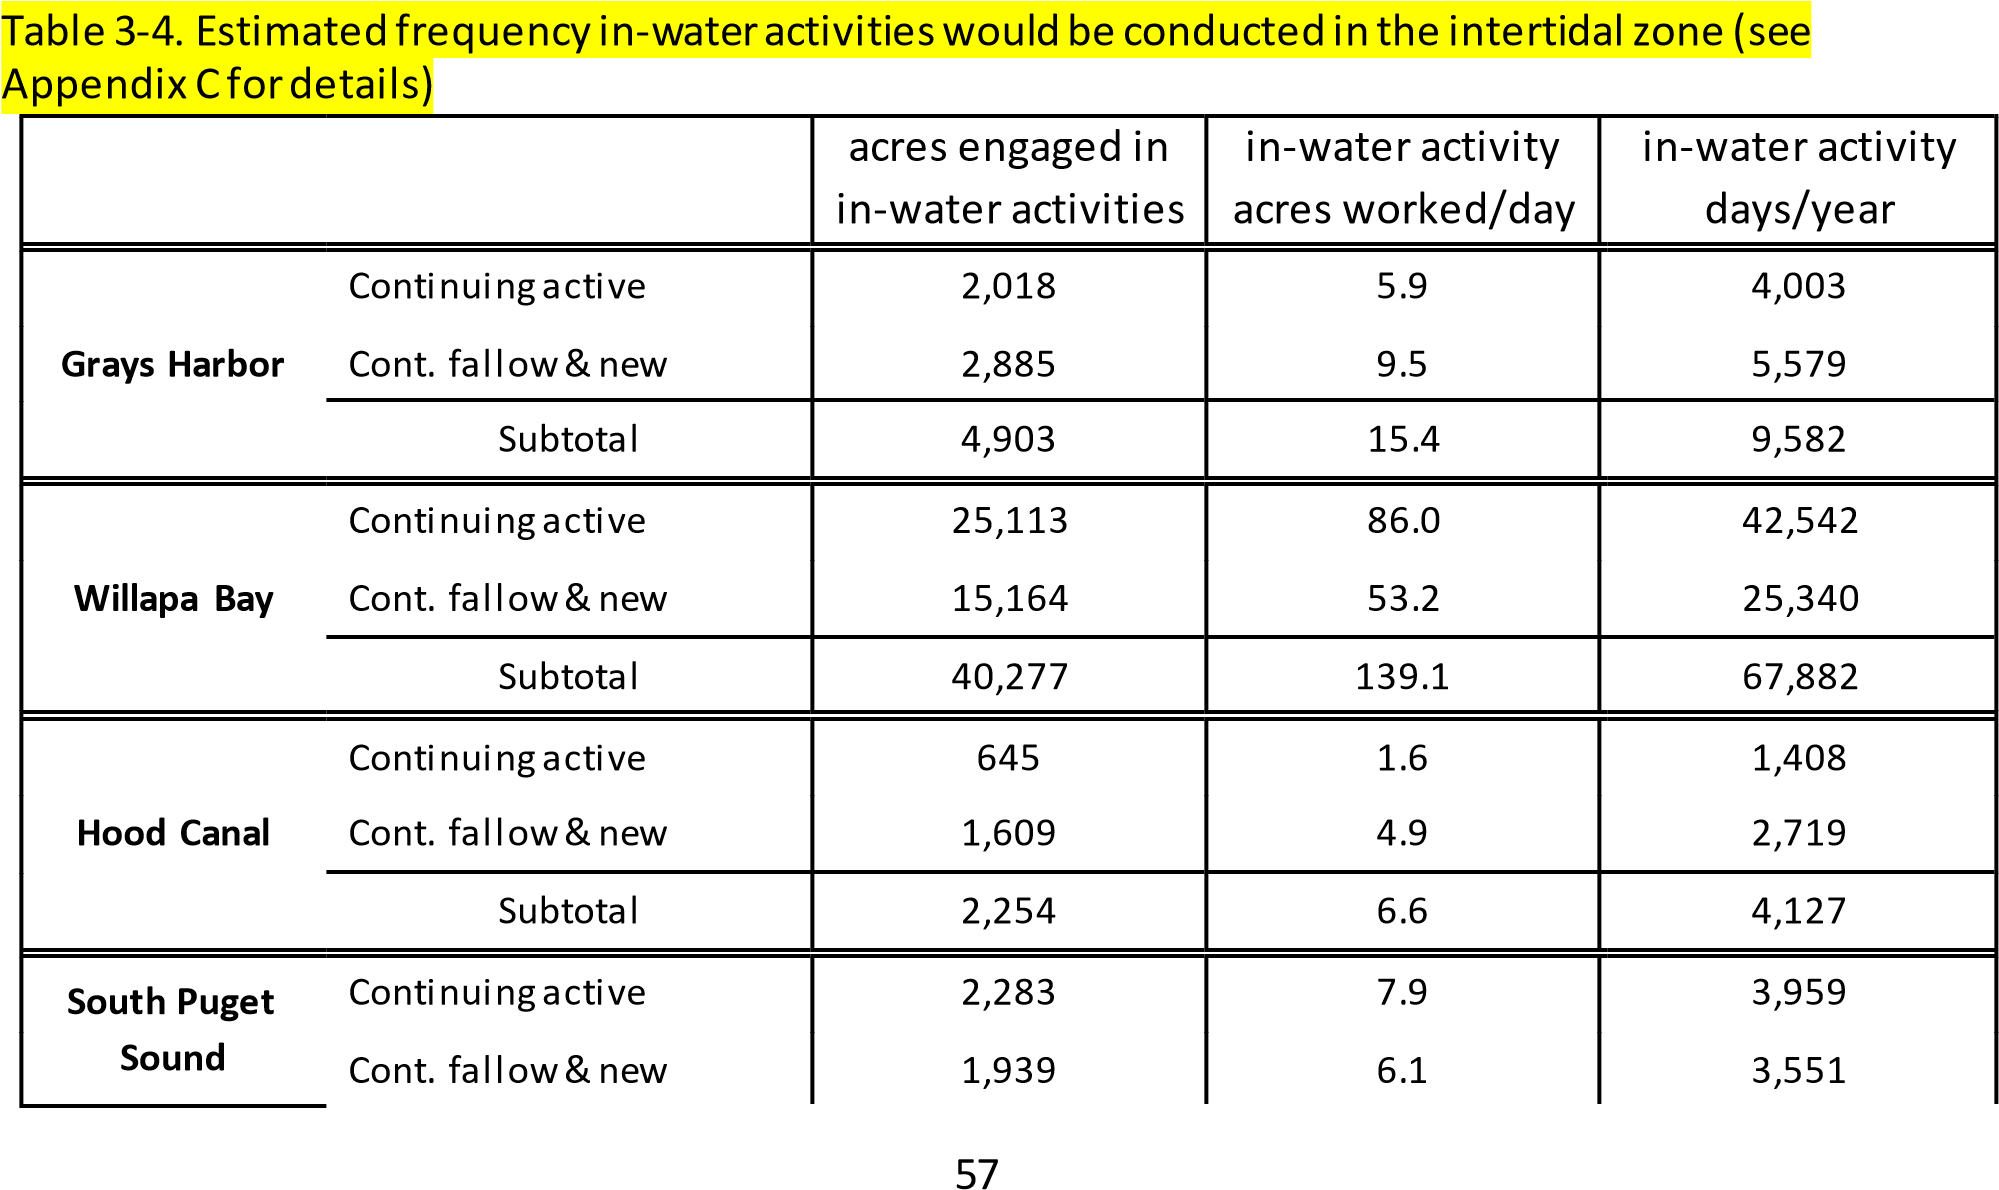

Note: acres worked/day assumes work occurs each work day throughout the year (260 work days/yr)
3.2.4. Cover Nets and Artificial Structure
Culture methods that result in a change to the substrate (e.g., bag culture, cover nets) would result in impacts that may be more or less continuous for the period of the permit authorization because there is no recovery or return to the prior substrate and habitat conditions. A new crop of bags would be placed shortly after the previous crop is harvested. Geoduck culture would result in periods with and without structure. Depending on individual grower practices, structure to support geoduck culture is expected to occur between 30 and 100% of the time.
The placement of artificial structure for growing shellfish occurs in all the geographic regions. The number of acres potentially with artificial structure is summarized by region in Table 3-5. These acreages are best interpreted as a maximum for each culture method which, if implemented, would result in a less than equivalent decrease in acreage for another activity in the region (see discussion in Appendix B). The geographic locations where cover nets would occur for the continuing active and fallow acres are illustrated in Appendix G. It is assumed that all new aquaculture activities will also employ methods using artificial structure. Restoration and recreation related activities are generally not expected to employ artificial structure although there may some exceptions. Table 3-5. Artificial structure by region
|
|
Grays Harbor |
Willapa Bay |
Hood Canal |
South Puget Sound |
North Puget |
|
|
oyster longline/stake |
active |
732 |
4,377 |
268 |
171 |
719 |
|
fallow |
533 |
1,913 |
77 |
51 |
2,081 |
|
|
rack and/or bags (clam and oyster) |
active |
29 |
829 |
115 |
189 |
328 |
|
fallow |
6 |
72 |
23 |
51 |
2,050 |
|
|
geoduck tubes |
active |
0 |
1 |
453 |
931 |
369 |
|
fallow |
0 |
67 |
110 |
518 |
2,108 |
|
|
cover nets |
active |
0 |
3,380 |
538 |
2,011 |
637 |
|
fallow |
0 |
2,637 |
337 |
724 |
2,204 |
|
|
new aquaculture |
100 |
100 |
438 |
448 |
315 |
|
|
total |
active |
861 |
8,687 |
1,812 |
3,750 |
2,368 |
58
fallow & new
639
4
,789
985
1
,792
,758
8
total (plastic
structure only)
active
129
,310
4
1
,544
3
,579
1
,649
fallow & new
106
2
,876
908
,741
1
,677
6
Notes:
- Acreages are likely overstated by some unknown amount due to double or triple counting associated with limited detail on permit applications (See App. B). Acreages are best interpreted as a maximum for each activity which, if implemented, would result in a less than equivalent decrease in acreage for another activity in the region.
- All new acres assumed to potentially contain plastic structure or longline/stake.
3.2.5. Eelgrass
The continuing active and fallow aquaculture acres could potentially occur in areas with eelgrass. A geographic analysis was conducted to estimate the aquaculture acreage potentially co-located with eelgrass. A description of the analysis, detailed results, and figures illustrating geographic locations where aquaculture and eelgrass are co-located can be found in Appendix D. The results provide a conservative estimate of aquaculture co-located with eelgrass appropriate for this analysis. The results are summarized in Table 3-6. They suggest there is substantial overlap between eelgrass and much of the continuing active and fallow aquaculture acreage. This pattern occurs in all the geographic regions. An estimated 14,803 acres of continuing active aquaculture is potentially co-located with eelgrass across all the geographic regions. This results in reduced productivity and habitat function for this eelgrass as discussed in Section 7.1. This is an ongoing effect under the environmental baseline that will continue under the proposed action. An estimated 11,227 acres of continuing fallow acreage would be colocated with eelgrass under the proposed action. Effects to eelgrass in the fallow areas would be considered new effects relative to the environmental baseline. The magnitude of effect would be dependent on the type of culture method employed and the activities conducted as described in Section
7.1.
Willapa Bay has by far the most overlap between eelgrass and the continuing active and fallow acres. This is followed by the North Puget Sound and Grays Harbor regions where over 1,000 acres of eelgrass are estimated to overlap with the fallow acreage. Aquaculture activities (active and fallow) are more often than not co-located with eelgrass in Willapa Bay, Grays Harbor, and the North Puget Sound Region. In the Hood Canal region, aquaculture acreage is equally split between areas with and without eelgrass. The South Puget Sound region appears to be the notable exception where a minority of the acreage is co-located with eelgrass. Continuing aquaculture activities would occur in 49% of the total mapped eelgrass acreage in Willapa Bay and 21% of the mapped eelgrass in Hood Canal. These percentages are less in the other regions.
Table 3-6. Summary of shellfish activities potentially co-located with eelgrass
|
|
Grays Harbor |
Willapa Bay |
Hood Canal |
South Puget Sound |
North Puget Sound |
Total |
|
# continuing active footprints |
17 |
161 |
34 |
2 |
21 |
235 |
|
continuing active acres |
766 |
12,170 |
392 |
180 |
1,131 |
14,803 |
59
|
# continuing fallow footprints |
13 |
81 |
42 |
1 |
13 |
150 |
|
continuing fallow acres |
1,152 |
7,448 |
294 |
95 |
2,239 |
11,227 |
|
Total acres (active & fallow): |
1,918 |
19,618 |
685 |
275 |
3,370 |
25,866 |
|
% of continuing active acreage potentially colocated with eelgrass |
67% |
74% |
41% |
8% |
84% |
66% |
|
% of continuing fallow acreage potentially colocated with eelgrass |
63% |
79% |
73% |
12% |
96% |
76% |
|
% of eelgrass in region potentially co-located with aquaculture (active & fallow) |
5% |
49% |
21% |
9% |
7% |
20% |
Note: See Appendix D for more detail, summary of methodology, and geographic locations
3.2.6. Forage Fish
The continuing active and fallow acreages could be co-located with forage fish spawning areas and thus affect spawning success as discussed previously in Section 7.1. A geographic analysis was conducted to estimate the aquaculture acreage potentially co-located with forage fish spawning areas. A description of the analysis, detailed results, and figures illustrating geographic locations where aquaculture and forage fish spawning are co-located can be found in Appendix E. The analysis is summarized in Table 3-7 and suggests there is substantial overlap between forage fish spawning locations and aquaculture activities. There are an estimated total of 3,297 fallow acres across all regions co-located with forage fish spawning areas. In the two Puget Sound regions and in Hood Canal, active and fallow acreage is colocated with mapped spawning habitat for all three forage fish species analyzed. In Grays Harbor and Willapa Bay, aquaculture acreage appears co-located only with herring spawning areas.
Table 3-7. Summary of continuing active and fallow acreage potentially co-located with WDFW mapped forage fish spawning areas
|
|
Grays Harbor |
Willapa Bay |
Hood Canal |
South Puget Sound |
North Puget Sound |
Total |
|
Herring continuing active acres |
73 |
2,200 |
211 |
79 |
486 |
3,049 |
|
continuing fallow acres |
0 |
510 |
58 |
14 |
2,184 |
2,766 |
|
Surf smelt continuing active acres |
0 |
0 |
130 |
532 |
59 |
721 |
|
continuing fallow acres |
0 |
0 |
67 |
359 |
15 |
441 |
|
Sand lance continuing active acres |
0 |
0 |
169 |
78 |
79 |
326 |
|
continuing fallow acres |
0 |
0 |
28 |
20 |
42 |
90 |
|
total active acres co-located with spawning areas |
73 |
2,200 |
510 |
688 |
623 |
4,094 |
60
|
% of total active acres colocated with spawning areas |
6% |
13% |
54% |
29% |
46% |
18% |
|
total fallow acres co-located with spawning areas |
0 |
510 |
153 |
394 |
2,241 |
3,297 |
|
% of total fallow acres colocated with spawning areas |
0% |
5% |
37% |
50% |
96% |
22% |
|
cumulative total (active + fallow): |
73 |
2,710 |
663 |
1082 |
2,864 |
7,391 |
|
% of cumulative total colocated with spawning areas |
2% |
10% |
49% |
34% |
78% |
20% |
Note: See Appendix E for more detail, summary of methodology, and maps.
The analysis suggests that Willapa Bay and North Puget Sound are the regions where the most overlap may occur on an acreage basis. Relative to the total mapped herring spawning area in each region, activities in Willapa Bay tend to occur in well over half of the mapped spawning area, by far the largest proportion of any of the regions. Most of this overlap is with ongoing aquaculture activities. The North Puget Sound region contains the most fallow acres (2,241 acres) potentially co-located with forage fish spawning areas. Much of this is overlap with the herring spawning area in Samish Bay. The South Puget Sound region active and fallow acres are co-located more with surf smelt spawning areas relative to the other two species.
Table 3-8. Percent of total mapped herring spawning area potentially affected by continuing activities in active and fallow areas
|
|
Grays Harbor |
Willapa Bay |
Hood Canal |
South Puget Sound |
North Puget |
|
Total WDFW mapped herring spawning acres |
462 |
4,691 |
5,179 |
4,740 |
Sound 33,730 |
|
% of total mapped herring acres that potentially overlap with continuing active acres |
16% |
47% |
4% |
2% |
1% |
|
% of total mapped herring acres that potentially overlap with continuing fallow acres |
0% |
11% |
1% |
0.3% |
6% |
3.3. Summary of Primary Effects by Region
This section summarizes the future expected activities and habitat effects for each of the geographic regions.
3.3.1. Grays Harbor
Oyster bottom culture and its related activities predominate in Grays Harbor with longline culture also common. In-water activities common to the region include dredging, harrowing, and longline harvest.
61
This is expected to continue in the future. Fallow and new acreage is also anticipated to be predominantly for oyster culture using the same methods. The mechanical clam harvester and cover nets are being introduced to Grays Harbor on 363 acres of existing project area. It is assumed that all anticipated new activities could contain cover nets or bags for clam culture.
A total of 5% of the total tidelands in the region would be altered from the current relatively undisturbed condition to an aquaculture farm with corresponding effects on the habitat and species. Effects from activities conducted on this acreage would persist for the duration of the permit authorization and likely longer assuming the farm remains in business. Cumulatively, effects from all shellfish activities including on acreage classified as continuing active would occur on 7.5% of the tidelands in Grays Harbor. Effects would be concentrated in the North and South lobes of the embayment on the extensive tidelands in these areas (see Figure D-1).
There are an estimated 1,152 fallow acres co-located with eelgrass in Grays Harbor. The action assumes oyster bottom and longline culture methods would occur in these areas in the future. This would substantially reduce or eliminate the eelgrass in these areas at least during significant portions of the culture and harvest cycle. It does not appear that any fallow acreage is co-located with forage fish spawning areas so no impact to these species is anticipated.
Temporary habitat effects of the activities include short-term degradation of water quality, noise and general activity disturbance, and temporary decreases in benthic community abundance. These activities would be expected to displace fish and other species in the immediate vicinity of the activity. The frequency of in-water work is conservatively estimated to be 10 acres worked per day averaged over one year for activities on fallow and new acres and 15 acres per day for all shellfish activities, which is 0.04% of the total tideland area in the Grays Harbor region.
3.3.2. Willapa Bay
Oyster bottom culture is the primary culture method in Willapa Bay with a lesser amount of longline culture, limited oyster rack and bag culture and some clam culture. There does appear to be substantial acreage with cover nets. In-water activities common to the region include dredging, harrowing, graveling, and longline harvest. This relative distribution of culture methods and individual activities is expected to continue in the future on both continuing active and fallow acres. New activities are expected to be focused on geoduck culture with lesser amounts of clam, oyster, and mussel culture. No restoration, recreation, or subtidal geoduck activities are expected to occur in Grays Harbor.
A total of 19% of the total tidelands in the region would be altered from the current relatively undisturbed condition to an aquaculture farm with corresponding effects on the habitat and species. Effects from activities conducted on this acreage would persist for as long as the permit authorization or the work occurs/farm remains in business. Cumulatively, effects from all shellfish activities including on acreage classified as continuing active would occur on 53% of the tidelands in Willapa Bay. Effects would occur throughout the region on the extensive tidelands that characterize the embayment.
There are an estimated 7,448 fallow acres co-located with eelgrass in Willapa Bay. The action assumes oyster bottom and the other activities listed above would occur in these areas in the future. This would substantially reduce or eliminate the eelgrass in these areas at least during significant portions of the culture and harvest cycle. There are an estimated 510 fallow acres co-located with herring spawning
62
areas. Spawning in these areas would be negatively affected primarily by the loss of eelgrass spawning substrate.
Temporary habitat effects of the activities include short-term degradation of water quality, noise and general activity disturbance, and temporary decreases in benthic community abundance. These activities would be expected to displace fish and other species in the immediate vicinity of the activity. The frequency of in-water work is conservatively estimated to be 53 acres worked per day averaged over one year for activities on fallow and new acres and 139 acres per day for all shellfish activities, which is 0.3% of the total tideland area in the Willapa Bay region.
3.3.3. Hood Canal
Oyster and clam culture are both common in Hood Canal with a smaller amount of geoduck. Bottom culture is the primary method for growing all species. There are lesser amounts of longline and rack and/or bag culture. An estimated 538 active and 337 fallow acres are estimated to use cover nets which is about 10% of the total acreage in Hood Canal. In-water activities that occur include graveling, dive harvest, and longline harvest. This relative distribution of culture methods and individual activities is expected to continue in the future on both continuing active, fallow, and new aquaculture acres.
A total of 8% of the total tidelands in the region would be altered from the current relatively undisturbed condition to an aquaculture farm with corresponding effects on the habitat and species. Effects from activities conducted on this acreage would persist for as long as the permit authorization or the work occurs/farm remains in business. Cumulatively, effects from all shellfish activities including on acreage classified as continuing active would occur on 16% of the tidelands. Hood Canal is a deep fiord like embayment characterized by narrow ribbons of tidelands along the shoreline interrupted by small estuaries at river mouths that have a somewhat greater tideland area depending on the size of the river. Activities and their effects would be focused along these shoreline areas and estuaries throughout the region.
There are an estimated 257 fallow acres co-located with eelgrass in Hood Canal. The action assumes oyster and clam bottom and the other activities listed above would occur in these areas in the future. This would substantially reduce or eliminate the eelgrass in these areas at least during significant portions of the culture and harvest cycle. There are an estimated 153 fallow acres co-located with forage fish spawning areas. Spawning in these areas would be negatively affected primarily by the loss of aquatic vegetation spawning substrate and smothering of eggs.
Temporary habitat effects of the activities include short-term degradation of water quality, noise and general activity disturbance, and temporary decreases in benthic community abundance. These activities would be expected to displace fish and other species in the immediate vicinity of the activity. The frequency of in-water work is conservatively estimated to be 5 acres worked per day averaged over one year for activities on fallow and new acres and 7 acres per day for all shellfish activities, which is 0.05% of the total tideland area in the Hood Canal region.
3.3.4. South Puget Sound
Oyster and clam culture are both common in South Puget Sound followed closely by geoduck. Bottom culture is the primary method for growing all species with some longline and rack and/or bag culture.
63
Cover nets are common and occur on about 75% of the continuing footprints. An estimated 2,011 active and 724 fallow acres are estimated to use cover nets. In-water activities that occur include dredging, graveling, dive harvest, and longline harvest. This relative distribution of culture methods and individual activities is expected to continue in the future on both continuing active, fallow, and new aquaculture acres.
A total of 5% of the total tidelands in the region would be altered from the current relatively undisturbed condition to an aquaculture farm with corresponding effects on the habitat and species. Effects from activities conducted on this acreage would persist for as long as the permit authorization or the work occurs/farm remains in business. Cumulatively, effects from all shellfish activities including on acreage classified as continuing active would occur on 12% of the tidelands. Activities and effects in the South Puget Sound region would be focused in the south and east part of the region along shoreline areas and in small embayments although new activities could occur throughout the region. Most of the acreage in some of these smaller estuaries may be engaged aquaculture.
There are an estimated 115 fallow acres co-located with eelgrass in South Puget Sound. The action assumes the shellfish activities listed above would occur in these areas in the future. This would substantially reduce or eliminate the eelgrass in these areas at least during significant portions of the culture and harvest cycle. There are an estimated 394 fallow acres co-located with forage fish spawning areas, primarily for surf smelt. Spawning in these areas would be negatively affected primarily by the smothering of eggs.
Temporary habitat effects of the activities include short-term degradation of water quality, noise and general activity disturbance, and temporary decreases in benthic community abundance. These activities would be expected to displace fish and other species in the immediate vicinity of the activity. The frequency of in-water work is conservatively estimated to be 6 acres worked per day averaged over one year for activities on fallow and new acres and 14 acres per day for all shellfish activities, which is 0.05% of the total tideland area in the South Puget Sound region. Given the concentration of activity acreage in the south and east corner of the region, the frequency of activity in this area would be quite a bit higher than this average.
3.3.5. North Puget Sound
Oyster and clam culture are both common in North Puget Sound with a very small amount of geoduck. Bottom culture is the primary method for growing all species with some longline, stake, and rack and bag culture. Cover nets are common and occur on about 46% of the continuing footprints. An estimated 637 active and 2,204 fallow acres are estimated to use cover nets. In-water activities that occur include graveling, harrowing, dive harvest, and longline harvest. This relative distribution of culture methods and individual activities is expected to continue in the future on both continuing active, fallow, and new aquaculture acres.
A total of 3% of the total tidelands in the region would be altered from the current relatively undisturbed condition to an aquaculture farm with corresponding effects on the habitat and species. Effects from activities conducted on this acreage would persist for as long as the permit authorization or the work occurs/farm remains in business. Cumulatively, effects from all shellfish activities including on acreage classified as continuing active would occur on 5% of the tidelands. Activities and effects in the
64
North Puget Sound region would be focused in a handful of embayments including Samish Bay, Discovery Bay, Sequim Bay, Kilisut Harbor and in the vicinity of Skagit Bay. The percent of tidelands engaged in shellfish activities in these embayments would be significantly higher than this regional average. For example, 50% of the tidelands in Samish Bay contain continuing active or fallow acreage. New activities could occur throughout the region.
There are an estimated 2,194 fallow acres co-located with eelgrass in North Puget Sound. The action assumes the shellfish activities listed above would occur in these areas in the future. This would substantially reduce or eliminate the eelgrass in these areas at least during significant portions of the culture and harvest cycle. There are an estimated 2,241 fallow acres co-located with forage fish spawning areas, primarily for herring. Spawning in these areas would be negatively affected by the loss of eelgrass spawning substrate.
Temporary habitat effects of the activities include short-term degradation of water quality, noise and general activity disturbance, and temporary decreases in benthic community abundance. These activities would be expected to displace fish and other species in the immediate vicinity of the activity. The frequency of in-water work is conservatively estimated to be 11 acres worked per day averaged over one year for activities on fallow and new acres and 18 acres per day for all shellfish activities, which is 0.02% of the total tideland area in the region. The frequency of activity in the embayments where activities are concentrated would be significantly higher than this regional average.
65
4. Cumulative Impacts
This analysis assesses cumulative impacts of the proposed action as defined under the National Environmental Policy Act (NEPA) and the CWA Section 404(b)(1) regulations. Under NEPA, a cumulative impact as defined as follows:
Cumulative impact is the impact on the environment which results from the incremental impact of the action when added to other past, present, and reasonably foreseeable future actions regardless of what agency (Federal or non-Federal) or person undertakes such other actions. Cumulative impacts can result from individually minor but collectively significant actions taking place over a period of time (40 CFR 1508.7).
A determination of significance under NEPA requires considerations of both context and intensity. Context “means that the significance of an action must be analyzed in several contexts such as society as a whole (human, national), the affected region, the affected interests, and the locality. Significance varies with the setting of the proposed action. For instance, in the case of a site-specific action, significance would usually depend upon the effects in the locale rather than in the world as a whole. Both short- and long-term effects are relevant (40 CFR 1508.27(a)). Intensity “refers to the severity of impact” (40 CFR 1508.27(b)). According to the CFR, the following should be considered when evaluating intensity:
- Impacts that may be both beneficial and adverse. A significant effect may exist even if the Federal agency believes that on balance the effect will be beneficial.
- The degree to which the proposed action affects public health or safety.
- Unique characteristics of the geographic area such as proximity to historic or cultural resources, park lands, prime farmlands, wetlands, wild and scenic rivers, or ecologically critical areas.
- The degree to which the effects on the quality of the human environment are likely to be highly controversial.
- The degree to which the possible effects on the human environment are highly uncertain or involve unique or unknown risks.
- The degree to which the action may establish a precedent for future actions with significant effects or represents a decision in principle about a future consideration.
- Whether the action is related to other actions with individually insignificant but cumulatively significant impacts. Significance exists if it is reasonable to anticipate a cumulatively significant impact on the environment. Significance cannot be avoided by terming an action temporary or by breaking it down into small component parts.
- The degree to which the action may adversely affect districts, sites, highways, structures, or objects listed in or eligible for listing in the National Register of Historic Places or may cause loss or destruction of significant scientific, cultural, or historical resources.
66
- The degree to which the action may adversely affect an endangered or threatened species or its habitat that has been determined to be critical under the Endangered Species Act of 1973.
- Whether the action threatens a violation of Federal, State, or local law or requirements imposed for the protection of the environment.
The CEQ guidance document “Considering Cumulative Effects under the National Environmental Policy Act” (1997) and the 2005 memo from CEQ (CEQ 2005) provides guidance on how to structure cumulative effects analysis. The steps are summarized in Table 4-1.
Table 4-1. Steps in cumulative effects analysis to be addressed in each component of environmental impact assessment (from CEQ 1997).

Under CWA Section 404(b)(1) cumulative impacts are defined as follows:
Determination of cumulative effects on the aquatic ecosystem (40 CFR 230.11(g)).
- Cumulative impacts are the changes in an aquatic ecosystem that are attributable to the collective effect of a number of individual discharges of dredged or fill material. Although the
67
impact of a particular discharge may constitute a minor change in itself, the cumulative effect of numerous such piecemeal changes can result in a major impairment of the water resources and interfere with the productivity and water quality of existing aquatic ecosystems.
- Cumulative effects attributable to the discharge of dredged or fill material in waters of the United States should be predicted to the extent reasonable and practical. The permitting authority shall collect information and solicit information from other sources about the cumulative impacts on the aquatic ecosystem. This information shall be documented and considered during the decision-making process concerning the evaluation of individual permit applications, the issuance of a General permit, and monitoring and enforcement of existing permits.
The 404(b)(1) guidelines further state:
To predict cumulative effects, the evaluation shall include the number of individual discharge activities likely to be regulated under a General permit until its expiration, including repetitions of individual discharge activities at a single location (40 CFR 230.7b3).
The 404(b)(1) guidelines outlined in 40 CFR 230 guide how the analysis is conducted. This analysis only evaluates the proposal against 230.10 (c), determination of significant degradation, which is only one of the compliance requirements. Evaluation of the proposal against Subparts C thru F for cumulative effects are discussed below.
4.1. Scope of Analysis
CEQ guidance recommends that cumulative effects analysis focus on effects to the resources affected by the proposed action as opposed to the traditional focus on effects based on the perspective of the action (CEQ 2005, CEQ 1997). A focus on the resource helps ensure all effects to the resource itself are discussed in the context of the action. This approach has been adopted for the 2017 NWP 48 cumulative effects analysis. An important component of the analysis is identifying other unrelated actions, past, present, and reasonably foreseeable in the future, that have or could potentially affect the resources affected by the proposed action.
The 404(b)(1) guidelines require cumulative effects analysis evaluate effects of all potential activity conducted under the General permit (e.g., each permit verification). Effects to resources from other activities or a reissuance of the permit are beyond the scope. The CEQ guidelines for the NEPA analysis thus are broader in identifying and evaluating effects to resources. The analysis below is thus focused on this broader evaluation under NEPA. Cumulative effects under CWA would fall within the effects envelope described for NEPA.
4.1.1. Resources Affected
For practical purposes, the geographic footprint of the proposed action is Willapa Bay, Grays Harbor, and the greater Puget Sound or Salish Sea. This is where all of the historical NWP 48 authorized work has occurred in the past and where it is expected to occur for the 2017 version of the NWP 48. Effects
68
to resources could thus occur in these regions. Due to the broad geographic area encompassed by the proposed action, the resources affected vary depending on the region.
In addition to being potentially affected by the proposed action, the following screening criteria were used to identify important affected resources for the analysis:
- listed under the ESA, MSA or designated critical habitat in area;
- provides a key ecological role (e.g., important component of the food web);
- important to commercial or recreational fisheries;
- is the focus of significant regional or national restoration or planning initiatives;
- managed with some degree of regional or national protected status;
Resources that meet the above criteria have been categorized according to the three primary geographic areas in Table 4-2.
Table 4-2. Important resources affected by the proposed action
|
Grays Harbor |
Willapa Bay |
Puget Sound |
|
Eelgrass (Z. marina) |
Eelgrass (Z. marina) |
Eelgrass (Z. marina) |
|
Benthic invertebrate community |
Benthic invertebrate community |
Benthic invertebrate community |
|
Salmon species (Chinook, coho, chum) |
Salmon species (Chinook, coho, chum) |
Salmon species (Chinook, coho, chum) |
|
Pacific herring |
Pacific herring |
Pacific herring, sand lance, surf smelt |
|
Dungeness crab |
Dungeness crab |
Dungeness crab |
|
Green sturgeon |
Green sturgeon |
Canary rockfish, bocaccio |
|
Pacific groundfishes (E. sole) |
Ground fish (E. sole) |
|
|
Bull trout |
|
Bull trout |
|
Snowy plover |
Snowy plover |
|
Consistent with CEQ guidance the cumulative effects analysis is not an exhaustive analysis on all species and resources affected. Rather the analysis is focused on those resources that are measurably affected by the action in an important way and that could be further impacted by other actions past, present, or reasonably foreseeable so that a more comprehensive review can be conducted on a smaller number of resources.
The effects analysis is focused on eelgrass, sand lance/surf smelt and the benthic community. The other species listed in Table 4-2 are not discussed.
The effects on some species, such as Dungeness crab and eelgrass, are directly related to effects on eelgrass. Other species such as salmon, rockfish and bull trout, while affected by the proposed action and other cumulative actions, can be evaluated through a surrogate species such as surf smelt. While not a perfect surrogate, this approach allows for a more comprehensive analysis as discussed above.
69
While snowy plover may be affected by the placement of new aquaculture in breeding areas or designated critical habitat for this species, activities currently do not occur within these areas and it is expected that they will be precluded in the future.
4.1.2. Geographic Scope of Cumulative Effects Analysis
The geographic area for the proposed action includes the Puget Sound/Salish Sea, Willapa Bay, and Grays Harbor. The Columbia River and coastal beaches are also included but no work is expected to be authorized here under NWP 48. Within this broad area, activities expected to be authorized by NWP 48 are concentrated geographically in Willapa Bay, certain areas of Grays Harbor, southeast Puget Sound, Hood Canal, and several embayments in north Puget Sound including.
The resources identified above extend broadly across the landscape. The geographic focus of the analysis is the State of Washington. Analysis is generally conducted at the watershed scale although effects to some species may extend beyond this scale due to the migratory range of the species. This is discussed in more detail in the sections discussing the individual resources.
The broad geographic area necessarily means that there are potentially many past, present, and future actions that could have some effect on the resources. Consistent with CEQ guidance for conducting cumulative effects analysis, the analysis is focused only on those actions with the greatest potential for meaningfully affecting the identified resources.
4.1.3. Temporal Scope of Cumulative Effects Analysis
The timeframe for cumulative effects analysis typically first considers the timeframe for the proposed action, which in this case is five years (CEQ 1997). Under the 404(b)(1) guidelines, the period of analysis is specifically defined as the expiration date of the General permit (40 CFR 230.7b3). This permit will expire in 2022. Effects of the action would then begin to dissipate after 2022. However, while the timeframe of the permit itself is five years, the work itself and more importantly its effects are expected to continue well beyond 2022. As was the case with the 2012 NWP 48 that preceded it, the 2017 NWP 48 is likely to be reissued in 2022 which means most if not all of the activities authorized under the previous permit along with additional new project area will be reauthorized in the future. Thus while the activities authorized under the 2017 NWP 48 permit will cease to be authorized in 2022, the activities themselves will most assuredly continue and be subsequently authorized by the next version of NWP 48 in 2022. Prior permittees typically have a one year grace period to apply for and be authorized under the reissued permit. It would be the unusual case for aquaculture acreage to decrease in this currently expanding industry.
As discussed above, the focus of cumulative effects analysis is on the resource itself. Effects to resources would continue with the reissuance of the NWP 48 in 2022. An analysis of cumulative effects under NEPA must therefore consider this additional work because it results in continued if not expanded impacts on the resource. The reissuance of NWP 48 in 2022 represents a set of potential future cumulative impacts, much the way climate change could result in cumulative impacts.
Whether a 2022 version of the NWP 48 is considered part of the proposed action or a separate action unto itself, its cumulative effects must still be evaluated according to eth CEQ guidelines (CEQ 1997).
While there may be modifications to the reissued permit in 2022, these are anticipated to be minor and
70
all activities permitted in 2017 would also likely be eligible for the 2022 NWP 48, and subsequent versions of NWP 48. Selecting an appropriate timeframe for the analysis is somewhat arbitrary given that the aquaculture work is not expected to end but is instead expected to continue and become a more or less permanent feature of the environment. Aquaculture has been occurring on the landscape for over 100 years. The analysis therefore assumes that the work will continue and not end in 2022 upon the expiration of the 2017 NWP 48.
4.2. Eelgrass
The following summary of eelgrass and its ecosystem value is from WDNR 2015:
Eelgrass (Zostera marina) is an aquatic flowering plant found in fine grained intertidal and subtidal habitats. It provides numerous high-value regional ecosystem services within the coastal ecosystem. It creates structural complexity and supports high levels of biodiversity. Eelgrass serves as a focal habitat for perhaps hundreds of species in the Sound (Thom et al. 2011). It provides nursery habitat for economically important Dungeness crab and Pacific salmon (Fernandez et al. 1993, Phillips 1984, Simenstad 1994); spawning substrate for Pacific herring (Penttila 2007); and foraging habitat for numerous water birds including black brant. Eelgrass improves water quality by trapping and storing particulates and nutrients (Short and Short 1984, Gacia et al. 1999, Asmus & Asmus 2000); enhance productivity and alter nutrient cycling (Hemminga and Duarte 2000); mitigate wave energy and increase shoreline stabilization (Koch et al. 2006); and serve as a globally significant carbon sink (Fourqurean et al. 2012). Given the significance and diversity of the ecosystem functions and services provided by seagrass, Costanza et al. (1997) determined seagrass ecosystems to be one of Earth’s most valuable.
Natural conditions (especially water quality) play a significant role in controlling the distribution of eelgrass. Eelgrass meadows in Puget Sound are characterized by substantial interannual variability that appear to be related to the occurrence of El Niño climate events (Shafer 2015). Eelgrass areas on the Pacific coast can expand by as much as 5 meters (m) and contract by as much as 4 m annually (WDNR 2012).
4.2.1. Eelgrass status
Eelgrass (Z. marina) is protected by a number of Federal and State regulations as discussed below.
- Under the Magnuson-Stevens Fishery Conservation and Management Act (MSA), seagrasses, specifically native eelgrass, are designated as an essential fish habitat (EFH) habitat area of particular concern (HAPC) for Pacific Coast groundfishes and Pacific salmon (Chinook, coho, and pink) in Willapa Bay, Grays Harbor, and Puget Sound. HAPC designations are used to provide additional focus for conservation efforts. This indicates NOAA may have conservation recommendations to ensure projects do not harm bottom-dwelling fish if seagrasses are adversely affected by proposed actions.
- Aquatic vegetation, which includes eelgrass, is a primary constituent element for designated critical habitat for several species listed under the Endangered Species Act including Puget Sound Chinook salmon (70 FR 52630), Hood Canal summer run chum salmon (70 FR 52630), and Puget Sound steelhead (78 FR 2726). A programmatic ESA consultation for shellfish activities
71
including aquaculture concluded that terms and conditions restricting aquaculture in fallow areas were required to protect eelgrass (NOAA 2016).
- Eelgrass is considered a “special aquatic site” under the Clean Water Act (40 CFR 230.43). Special aquatic sites are “geographic areas, large or small, possessing special ecological characteristics of productivity, habitat, wildlife protection, or other important and easily disrupted ecological values. These areas are generally recognized as significantly influencing or positively contributing to the general overall environmental health or vitality of the entire ecosystem of a region” (40 CFR 230.3 (q-1)). “From a national perspective, the degradation or destruction of special aquatic sites, such as filling operations in wetlands, is considered to be among the most severe environmental impacts covered by these Guidelines. The guiding principle should be that degradation or destruction of special sites may represent an irreversible loss of valuable aquatic resources.” (40 CFR 230.1(d))
- According to EPA (2016): The objective of the CWA is to restore and maintain the chemical, physical, and biological integrity of the Nation’s waters. Toward achievement of this goal, the CWA prohibits the discharge of dredged or fill material into waters of the United States unless a permit issued by the Army Corps of Engineers or approved State under CWA Section 404 authorizes such a discharge. For every authorized discharge, the adverse impacts to wetlands, streams and other aquatic resources must be avoided and minimized to the extent practicable. For unavoidable impacts, compensatory mitigation is required to replace the loss of wetland and aquatic resource functions in the watershed. Compensatory mitigation refers to the restoration, establishment, enhancement, or in certain circumstances preservation of wetlands, streams or other aquatic resources for the purpose of offsetting unavoidable adverse impacts. Zostera marina is listed on the 2016 Wetland Plant List for the State of Washington (Lichvar et al. 2016).
- Native eelgrass is considered a ‘saltwater habitat of special concern’ by the State of Washington
(WAC 220-660-320). In administering the Hydraulic Project Approval (HPA) process, the Washington Department of Fish and Wildlife (WDFW) requires applicants to: 1) avoid impacting eelgrass, 2) minimize unavoidable impacts, and 3) mitigate for any impacts (WAC 220-660-350) (WDFW 2008, WDNR 2015).
- WDNR’s aquatic leasing program recognizes the regional ecosystem services provided by eelgrass beds and emphasizes impact avoidance during authorization of uses of state-owned aquatic lands to protect the sensitive aquatic habitat from disturbance (WDNR 2015).
Under the Washington State Shoreline Management Act, which implements the Coastal Zone
Management Act on 1972, the state is requiring updates of all local Shoreline Master Programs (SMPs). They developed guidelines for the development of the SMPs the local jurisdictions must follow in order for their SMP to be approved by the State. These guidelines have specific protections for eelgrass as described below.
- WAC 172-32-186(8) directs SMPs to “include policies and regulations designed to achieve no net loss of those ecological functions”. WDOE (2010) indicates that “the no net loss standard is designed to halt the introduction of new impacts to shoreline ecological functions resulting from new development. Both protection and restoration are needed to achieve no net loss.”
72
- Protecting critical saltwater habitats is important to achieving no net loss of ecological functions. The SMP Guidelines state, “Critical saltwater habitats require a higher level of protection due to the important ecological functions they provide” [WAC 173-26-221(2)(c)(iii)(A)]. Critical saltwater habitats include “…all kelp beds, eelgrass beds, spawning and holding areas for forage fish, such as herring, smelt and sandlance; subsistence, commercial and recreational shellfish beds; mudflats, intertidal habitats with vascular plants, and areas with which priority species have a primary association” (WAC 173-26-221(2)(c)(iii)(A)).
The SMP guidelines include specific provisions for aquaculture including:
- The SMP Guidelines state that aquaculture “should not be permitted where it would adversely impact eelgrass … Impacts to ecological functions shall be mitigated according to the mitigation sequence described in WAC 173-26-201 (2)(e)” .(WAC 173-26-241(3)(b)(i)(C)).
- Local governments should require buffers in order to avoid impacts to eelgrass and require monitoring to ensure the buffers are adequate (WDOE 2015).
- WDNR will establish eelgrass buffers on state managed aquatic lands based on individual site assessments in order to ensure environmental protection of state-owned aquatic resources (WDOE 2015).
The Puget Sound Partnership (PSP), a state agency leading the region’s collective effort to restore and protect Puget Sound, identified eelgrass as an indicator of the health of Puget Sound in recognition of the regional ecosystem services it provides and its sensitivity to changes in environmental conditions. PSP established a goal to increase eelgrass area by 20 percent relative to the 2000-2008 baseline of approximately 53,300 acres by 2020.
4.2.2. Historical context and past effects
The historical distribution of eelgrass in Puget Sound, Willapa Bay, and Grays Harbor is unknown. Available information on past effects is discussed below for each region.
The global literature strongly points to the overriding influence of human population driven land use changes and management practices in causing the loss of seagrasses (Thom et al. 2011). Surveys of local stakeholders identified dredging/filling, shoreline development, water quality, and commercial aquaculture as the most significant stressors on eelgrass (Thom et al. 2014). In Puget Sound, substantial losses are believed to be due to physical changes in shorelines, periodic physical disturbances, and degradation in water quality (Thom and Hallum 1990; Thom 1995; Dowty et al. 2010; Thom et al. 2011).
Eelgrass requires certain environmental conditions including appropriate tidal elevation, light, temperature, salinity, substrata, nutrients, waves, and current velocities (Philips 1984, Thom 2003, Koch 2001).
The WDNR contracted with Pacific Northwest National Laboratory to summarize and rank known stressors to eelgrass in Puget Sound. The summary of stressors on native eelgrass in Figure 4-1 is reproduced from the final report (Thom et al. 2011). The focus of the review was Puget Sound but the analysis is relevant to Willapa Bay and Grays Harbor to the extent the identified stressors occur. The results have been used to develop an eelgrass recovery strategy in Puget Sound (WDNR 2015).
73

Figure 4-1. Eelgrass stressor ranking table (from Thom et al. 2011). The stressor score is determined by assigned point values to stressor characteristic values. For most categories, High = 3, Medium = 2, and Low = 1, with the exception of the Reversibility category, in which High = 1 and Low = 3 (because high reversibility reduces the threat presented by a stressor). The final stressor score is the mean of all of the points for each stressor, with a value of 3 (red) indicating the highest possible threat to eelgrass and 1 (green) the lowest. All columns included are currently weighted equally in the calculations. The knowledge score is the mean number of asterisks assigned to each stressor (not including case studies). A high knowledge score (3, green) indicates the most information is available about the stressor, while a low score (1, red) indicates very little information is available.
Puget Sound
The following impacts to eelgrass have occurred in Puget Sound:
- Over the last 150 years river deltas have experienced a large loss in area and shoreline, tidal wetlands decreased by 56%, several small embayments have been eliminated and many beaches and bluffs have been modified as a result of shoreline armoring (Simenstad et al. 2011, Fresh et al. 2011). These have all contributed to losses of eelgrass. Eelgrass meadows have been lost due to diking, filling and dredging, but overall changes in Puget Sound have not been assessed due to a lack of comprehensive early records (Thom and Hallum 1990, WDNR 2015, Shelton et al. 2016).
74
- Historical information that does exists indicates that there have been eelgrass losses in Bellingham Bay (34 ha or 30% of the original mapped total) and the Snohomish River delta (70 ha, minimum of 15% lost) due primarily to filling and dredging (Thom and Hallum 1990). Padilla Bay eelgrass increased from 598 to 1541 ha possibly due to the diversion of the Skagit River away from the Bay (Thom and Hallum 1990). A survey of local stakeholders resulted in Figure 4-2 which illustrates areas with historical eelgrass but that were now absent of eelgrass (Thom et al. 2014).
- Though Olympia oysters currently are found throughout their historic distribution, less than 4 percent of historic core populations remain in Puget Sound. Approximately 155 acres remain, compared to 4,000-5,000 acres that historically supported dense assemblages of oysters (NOAA 2011). It is uncertain if the loss of oyster reefs provided an opportunity for eelgrass to expand as has been suggested in Willapa Bay (Blake and Ermgassen 2015), but this is certainly possible.
- Anecdotal accounts indicate widespread declines in eelgrass in certain areas over the last 30-40 years (Thom and Hallum 1990). In these cases, changes in water quality are suggested as the reason for the decreases.
- The invasion of Z. japonica has probably affected the native Zostera at the upper limits of its distribution. These species co-occur at the +0.3 to 1.0 m MLLW elevation on flats, and competition for space has been demonstrated (Harrison 1976). In addition, Z.japonica can invade newly created bare patches within native Zostera meadows, and hold this space for a considerable amount of time (Michele Nielsen, University of British Columbia, conversation, 5 May 1990, in Thom and Hallum 1990). The WDNR sampling program has sampled 378 sites in the greater Puget Sound and Z. japonica has been identified at 68 of those sites (Mach et al. 2010). The author indicates this likely underestimates the presence of Japonica because the sampling is not comprehensive.
- There has been a decadal decline in eelgrass at the Skagit River delta, which has been identified as a priority for future restoration. Research has shown that most of the fluvial sediment delivered to the delta is currently exported offshore by channelized dike complexes. This has led to fragmentation of the eelgrass beds and degradation of other valued nearshore components (Grossman 2013, in WDNR 2015).
- Aquaculture has occurred in Puget Sound for many years. The effects of oyster culture on eelgrass have been discussed previously. In addition to these effects, West (1997) indicated that eelgrass was considered a nuisance species and was routinely removed by oyster growers in Puget Sound.
- In the more recent past Shelton (et al. 2016) indicates that over the past 40 years, eelgrass in Puget Sound has proven resilient to large-scale climatic and anthropogenic change. They indicate that substantial changes to eelgrass populations occur at the site and subsite level with no large scale trends and emphasize the role of local site specific drivers on eelgrass changes.
- Notable increases in eelgrass area occurred at two river deltas following major restoration projects: the Skokomish River delta (200 acres) in southern Hood Canal and the Nisqually River
75
delta in southern Puget Sound. Eelgrass gains at these deltas contrast sharply with nearby sites (WDNR 2015).
WDNR has conducted annual surveys of eelgrass in Puget Sound. These data indicate that Puget Sound native eelgrass area has been stable over the 2002-2013 monitoring record (WDNR 2015). There are no significant 11 year trends although there is some evidence of a general increase in eelgrass area between 2010 and 2013. Localized areas have seen both increases and decreases in eelgrass area.
WDNR estimates the long term average (2000-2013) eelgrass acreage is 22,000 ha (54,000 acres) (WDNR 2015). In 2013, WDNR estimated 22,610 ha (55,870 acres).
76
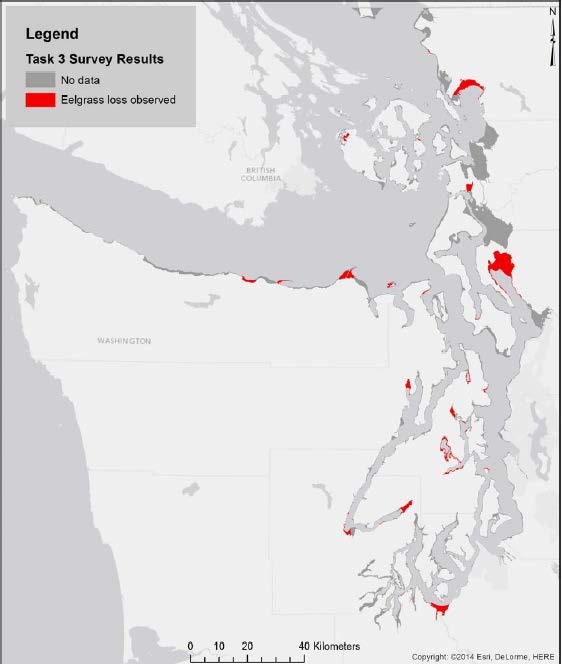
Figure 4-2. Areas identified as having previously contained eelgrass but currently is absent (from Thom et al 2014).
Willapa Bay
The historical coverage of eelgrass in Willapa Bay is unknown. However, the nearshore habitat in all three areas has been substantially altered since the mid-1800s.
Historical impacts to eelgrass include:
77
- Willapa’s shoreline has been modified by filling and diking (Fish and Wildlife Service (1970, cited in Philips 1984, Ruisink et al. 2006). An estimated 64% of estuarine wetlands have been lost from Willapa Bay (CRA 2007). Borde (2003) estimates that Willapa Bay tidal marsh decreased 36% between 1905 and 1974. It is unknown how much former eelgrass habitat has been lost. Fish and Wildlife Service (1970, cited in Philips 1984) indicate that deteriorating water quality from draining of fresh water marshes and construction of lagoon housing also impacted eelgrass.
- The impacts of diking and sediment loading from logging peaked by the mid-20th century and have since been constant or declined (Fish and Wildlife Service 1970, cited in Philips 1984, Ruisink et al. 2006)
- Historically, the Corps maintained dredged channels at the mouth of Willapa Bay, from the Bay entrance to Raymond, to Bay Center, and mooring areas in Tokeland and Nahcotta. Dikes and breakwaters were constructed. Channel deepening likely resulted in erosion of tidelflats/shallow subtidal areas along the margins of the dredged channel making them less habitable for eelgrass. This was observed in Grays Harbor (Borde et al 2003).
- Historical dredging has impacted eelgrass (Fish and Wildlife Service 1970, cited in Philips 1984). Prior to 1977, the Corps dredged 300,000 cy per year in Willapa Bay (Philips and Watson 1984). Historically, dredged spoils were disposed upland and in open water. The cumulative volume discharged to all the Willapa Bay open water disposal sites from 1996 to 2015 was 539,572 cy (Corps-DMMP 2016).
- construction of bulkhead, pier, and shoreline facilities., (Fish and Wildlife Service (1970, cited in Philips 1984)
- pollution from domestic waters, agricultural runoff, debris from log storage, wood chips (Fish and Wildlife Service (1970, cited in Philips 1984)
- invasion of non-native eelgrass (Z. Japonica) in the 1930s (Borde 2003). It generally occurs at higher tidal elevations but competes for space with Z. marina at the upper end of the Z. marina tidal range (refs). This species is currently the subject of control efforts that are discussed below. Harrison and Bigley (1982) estimated 17,000 ha of Z. japonica on intertidal flats in Willapa Bay. Ruesink et al. (2010) reported that, as of 1997, Z. marina occupied 9.6% of Willapa Bay and Z. japonica occupied 7.7%. Ten years later, in a 2006/2007 survey of Willapa Bay, Dr. Dumbauld with the U.S. Department of Agriculture (USDA) estimated that there were approximately 13,762 acres of Z. marina (15.6% of Willapa Bay) and 12,183 acres of Z. japonica (13.8% of Willapa Bay) (Dumbauld and McCoy 2006/2007). This did not include any acres with thinly populated Z. japonica. To illustrate that Z. japonica distribution in Willapa Bay is thought by some to be expanding, an estimation of Z. japonica distribution was conducted in 2012 using anecdotal data to estimate that 18,000 acres of Z. japonica occurred in Willapa Bay (WDOE 2014).
- Invasion of non-native cordgrass (Spartina alterniflora) which traps sediment and converts mudflat to salt grass.
78
- Damming and regulation of the Columbia River has greatly decreased sediment and freshwater inputs to the estuary (Borde et al 2003). Land use changes including forestry and agriculture increased siltation.
- Oyster culture began in the late 1800s in Willapa Bay to replace the overharvested native Olympia oyster population and continues to the present time. The effects of oyster culture on eelgrass have been discussed previously.
- In Willapa Bay, significant intertidal and shallow subtidal habitat was covered by Olympia oysters which likely competed with eelgrass for space although they also were reported to grow together (Blake and Zu Ermgassen 2015). Historical estimates for the area covered by oyster reef range up to 6,225 ha (15,382 acres) (ermgassen 2012 in Blake) and 9,774 ha (24,152 acres) or 27% of the bay bottom, to 3,141 ha (7,762 acres) (Dumbauld 2011) and 2,600 ha (6,425 acres) or 10% of bay bottom (Ruisink 2006). It is estimated that as much as 27% of the bay bottom could have been oyster bed (Blake and Zu Ermgassen 2015). These oyster beds were subsequently harvested creating an opportunity for eelgrass to expand its range (Dumbauld 2011, Blake ). Areas historically set aside as oyster reserves, that historically contained native oysters, now contain extensive areas of eelgrass (Dumbauld 2011). Dumbauld indicates of the 3995 ha of area historically set aside as oyster reserves, 1393 ha currently contain eelgrass (77% is native eelgrass) (Dumbauld 2015).
Willapa Bay and Grays Harbor are not annually monitored for eelgrass like Puget Sound. Recent trends in eelgrass coverage are not known. Current estimates of eelgrass (Z. marina) in Willapa Bay range from
39,861 acres for Z. marina and Z. japonica combined by WDNR (2001) to 17,000 acres for Z. marina and 9,000 acres for Z. japonica (Dumbauld and McCoy 2015) and 8,461 acres of Z. marina with a similar coverage area for Z. japonica (Ruesick et al. 2006). Borde et al. 2003 indicates that potential eelgrass habitat has increased by 1706 ha based on changes in bathymetry of Willapa Bay.
Grays Harbor
Similar to Willapa Bay and Puget Sound, historical eelgrass area is unknown but Grays Harbor has experienced extensive changes in the nearshore habitat due to diking, filling, and dredging (Borde et al, 2003). Anecdotal observations (Thom) indicated that some flats in the outer (South Bay) area of Grays Harbor were eroded shortly after the navigation channel was deepened in the early 1990s (Borde et al. 2003). Many of the other factors affecting eelgrass including invasion of Z. japonica, declines in water quality, and shoreline construction have also occurred in Grays Harbor. Miller (1977, in Mach et al. 2010) measured a 518% increase in Z. japonica in Grays Harbor from 680 to 4210 acres, though there is little information about its density and abundance across this area.
In recent years WDNR (2001) estimated 36,415 acres of Z. marina and Z. japonica combined in Grays
Harbor. Estimates for Z. marina alone in Grays Harbor ranged from 11,700 acres (Wyllie-Echeverria and Ackerman 2003), and 10,990 acres (Gatto 1978). Borde et al. 2003 indicates that potential eelgrass habitat increased by 1793 ha to 3099 ha based on changes in bathymetry of Grays Harbor between 1883 and 1956 (e.g., from a general deepening of the bay). It is unknown whether this translated to an actual increase in eelgrass. It is suggested that the change in bathymetry may be due to decreases in sediment supply from the Columbia River and dredging within the Bay.
79
4.2.3. Effects of the proposed action
The effects of the proposed action are discussed above in Section 3. In general the action will result in continued degradation/loss of eelgrass in areas that have been engaged in ongoing aquaculture, and new eelgrass degradation/loss in areas currently classified as fallow or project are that is not currently engaged in aquaculture but is expected to be put into aquaculture during the next five years. These project areas have no conditions or restrictions on conducting work in eelgrass. New project area, area that has never had historical aquaculture or is not part of holdings by an existing aquaculture farm, can impact up to a half acre of eelgrass. It is uncertain what degree this condition would affect shellfish activities in Washington State because of the many areas have been engaged in some form of aquaculture historically (including tribes) and the many existing growers/farms would likely not be restricted by this because any new areas they obtained could be absorbed into their larger project area. For purposes of this analysis it is assumed the half acre eelgrass impact restriction would have negligible relevance and offer negligible protection to eelgrass resources for the reasons stated above.
The current known distribution of eelgrass within the geographic area is illustrated in Appendix A.
Table 4-3. Estimated acres of eelgrass affected by the proposed action
 Grays Willapa Hood South Puget
Note: Eelgrass coverage estimates for Willapa Bay and Grays Harbor are likely high by a factor of 3 due to dated WDNR surveys using less accurate methods and that include Z. japonica.
4.2.4. Effects of other present day actions
Development and urbanization
Commercial and residential development produce a number of stressors to eelgrass including construction such as dredging and filling that physically removes eelgrass, overwater structures that shade eelgrass, and water quality impacts that negatively affected eelgrass. Current population density
(Figure 4-3) identifies where many of these stressors are concentrated currently. Visual analysis of Figure 4-3 illustrates the impact of urbanization of eelgrass. While eelgrass generally exists throughout the geographic area, there are noticeably less areas in along the urbanized east side of Puget Sound and
80
Kitsap County. Eelgrass is noticeably deficient in the southern reaches of Puget Sound. This is likely due to the low tides that occur during mid-day during the summer which desiccates eelgrass decreasing its productivity and survival (ref).
81
Figure 4-3. 2010 population density in western Washington State and mapped eelgrass
82
Outfalls and Nutrients
In Puget Sound, it is estimated the average annual dissolved inorganic nitrogen (DIN) loading from anthropogenic sources is 2.7 times the natural loading conditions (Mohamedali et al. 2011). Annual DIN loads were greatest in the main basin of Puget Sound and almost entirely a result of discharge from residential wastewater treatment facilities (Mohamedali et al. 2011). The DIN loads between Edmonds and the Tacoma Narrows bridge, an area with the greatest concentration of outfalls (Carmichael et al. 2009), were 3.6 times the average for greater Puget Sound, an area not including the Straits
(Mohamedali et al. 2011). The continued addition of DIN in excess of natural conditions will likely shift the carbon and nutrient balance in Puget Sound and develop conditions (e.g., eutrophication) less suitable for eelgrass (Gaeckle 2012). It has been shown that the construction of outfalls and the discharged effluent affect marine organisms and processes, and specifically eelgrass. The impacts to eelgrass range from physical effects on the environment where it grows to physiological effects on the plants. But little is known about these impacts in Puget Sound (Gaeckle 2012).
The areas within Puget Sound where eelgrass is most at risk include locations along the eastern side of the Sound where population density is highest (e.g., urban growth areas), near outfall discharge points, and at the mouths of major rivers. However, the major outfall discharge points that would be a direct source of contamination for eelgrass typically discharge deeper than the extent of existing eelgrass beds in Puget Sound (e.g., West Point Wastewater Treatment Plant, Brightwater Treatment Plant). Most other treatment facilities in Puget Sound discharge at or beyond the deepest extent of eelgrass (Gaeckel et al. 2015).
Other discharge points of concern include CSO and stormwater outlets. These sources typically discharge near eelgrass beds and tend to contain high concentrations of nutrients, metals, and contaminants. CSOs are mostly contained in areas of high population density near major cities most of which have eelgrass growing along the waterfront.
Another area of concern where eelgrass may be affected includes major river deltas that have high flow and sediment discharge and contain inputs from sewage treatment facilities among other upland sources. Eelgrass is currently growing at most of the major river deltas but restoring historical flow volumes, drainage patterns and filtration potential may enhance eelgrass across deltaic fronts (Grossman 2013, Grossman et al. 2011). In addition, improvements in sewage treatment will only enhance riverine water quality and provide a range of benefits downstream and into the Sound.
The potential effect on eelgrass from the quantity of outfalls (and associated loading) in the Central Puget Sound and Saratoga-Whidbey basins could be detrimental to eelgrass considering the anticipated population growth over the next decade (Gaeckel et al. 2015).
Outfall impacts to eelgrass range from physical effects on the environment where it grows, such as the installation of an outfall pipe, to physiological effects on the plants caused by shading due to nutrient triggered plankton blooms or compromised photosynthetic potential because of metal or contaminant toxicity (Lewis and Devereux 2009). Effects of anthropogenic containments in general are uncertain as limited study has occurred to date (Gaeckle 2016).
83

Figure 4-4. NPDES permitted outfalls in Puget Sound and eelgrass presence in adjacent shoreline segment from WDNR Shoreline inventory (2001). Figure reproduced from Geackel et al. 2015.
Nutrient (nitrogen and phosphate) concentrations have been increasing in Puget Sound. The reasons for this are uncertain but WDOE hypothesizes that human derived nutrients due to summer inputs by waste water treatment plants increases nitrogen in the summer when natural inputs from rivers typically decrease (Figure 4-5). This affects the nutrient balance of the food web and may be causing algal blooms (Roberts et al 2013). The presence of macroalgal blooms in particular is identified as a stressor for eelgrass due to deposition of masses of macrolgae directly on eelgrass. The role of phytoplankton blooms is less certain but could increase turbidity and reduce eelgrass health and growth (Thom et al.
2011). The quantitative effect on eelgrass is not known.
84

Figure 4-5. Dissolved inorganic nitrogen (DIN) input to Puget Sound from local rivers and water water treatment plants (WWTPs).
Herrera (2011) found that during storm events, median total nitrogen concentrations were higher in residential and agricultural subbasins (1.3 and 1.8 mg/L, respectively) relative to commercial/industrial and forested basins (0.3 and 0.4 mg/L, respectively). Increased development relative to forested basins is likely to increase nitrogen loads.
The deposition of organic matter in the nearshore if thick enough can result in sediment porewater becoming anaerobic. This produces hydrogen sulfide which is toxic to eelgrass (Thom et al. 2011). This can from storm water, log rafting, tree debris, and macroalgae piles. The extent of this in Puget Sound is expected to be low (Thom et al, 2011).
Disease
Wasting disease has been observed in eelgrass populations throughout most of Puget Sound (Thom et al 2011). It appears to not have a detrimental effect on survival of these populations, but there is limited information. Thom et al. 2011 suggests the disease may increase with expected changes in sea temperature and salinity.
85
Overwater structures
Overwater structures such as docks and piers cause loss of eelgrass by shading, altered wave energy pattern, altered substrate characteristics (Jones and Stokes 2006, Nightingale and Simenstad 2001). An inventory of overwater structures was conducted by WDNR (WDNR 2007). While the inventory is dated, it provides an indication of the magnitude of the impact. The number of overwater structures and total acres affected are illustrated in Table 4-4.
Table 4-4. Overwater structure inventoried by WDNR from 2002-2006 orthophotos.
|
|
Grays Harbor |
Willapa Bay |
Hood Canal |
South Puget Sound |
North Puget Sound |
|
Number of structures |
133 |
111 |
1156 |
4350 |
2481 |
|
Total acres |
53 |
22 |
174 |
975 |
560 |
Simenstad et al. (2011) estimated that overwater structures cover approximately 6.5 km2 of the Puget Sound intertidal. Thom e al. 2011 estimated an average of 4 ft2 of overwater structure per linear foot of shoreline across Puget Sound, with over 1,400 acres of overwater structures. Central Puget Sound contains the largest area covered by overwater structures and the greatest ratio of overwater structure to linear feet shoreline present. The San Juan region has the lowest density of overwater structures. It was estimated that 40% of the overwater structure area (560 acres) was collocated with eelgrass and thus would be affected (Thom et al. 2011).
Nightingale and Simenstad (2001) concluded that their empirical findings indicate that the cumulative impacts of overwater structures can have significant impacts on ambient wave energy patterns and substrate types. While this conclusion is not specific to eelgrass, these impacts directly affect eelgrass present at these locations.
Effects may be reduced due to increased knowledge of effects leading to care in placement location so as not to disturb eelgrass and/or installation of grating to allow light penetration which reduces the impact (Jones and Stokes 2006). Eelgrasses losses are minimized by WDFW hydraulic code rules that require overwater structures be designed or located to avoid shading or other impacts that could result in the loss of eelgrass (WAC 220-110-300(3) and (4)).
Corps permitting of overwater structures between 2007 and 2016 is illustrated in Figure 4-6 and includes both new structures and maintenance/repair of existing structures.
86
0
20
40
60
80
100
120
140
160
180
2007
2008
2009
2010
2011
2012
2013
2014
2015
2016
LOP
NWP 3
other NWPs
RGP
SP
Figure 4-6. Overwater structure permitting 2007-2016
Mooring buoys, anchors, and barge grounding
Improperly sited or designed mooring buoys and vessel anchoring can scour, shade, fragment, and increase eelgrass bed vulnerability to disturbances. Localized impacts are frequently concentrated within embayments with high densities of moored vessels (WDNR 2015). Barge groundings have damaged eelgrass at the Clinton ferry terminal and at Hood Canal Bridge, as well as smaller scale impacts near marinas (Thom et al 2011). These effects are generally small in scale, but there spatial extent is unknown. Effects are likely to increase as boat traffic increases (Thom et al. 2011). Recent Corps permitting of mooring buoys is illustrated in Figure 4-7.
0
20
40
60
80
100
120
2007
2008
2009
2010
2011
2012
2013
2014
2015
2016
LOP
NWP 1
NWP 3
NWP 9
NWP 10
SP
Figure 4-7. Recent Corps permits issued for mooring buoys in Washington State
87
Dredging projects
Construction projects that affect the substrate or that result in dredging or filling can adversely affect eelgrass. In most cases, project effects to eelgrass are mitigated. A summary of permits issued for nonCorps dredging and maintenance dredging activities conducted under NWPs are summarized in Figure 4-8. Corps maintenance dredging occurs regularly at many locations throughout Puget Sound and in Grays Harbor. Annual dredging in Puget Sound is 100,000 – 200,000 cy which is typically maintenance dredging of the Snohomish or Duwamish Rivers. An average of 1.7 million cubic yards is dredged annually from the Grays Harbor deep draft channel. The dredged material is disposed of at various approved disposal sites, including open-water disposal at the Point Chehalis, South Beach, South Jetty, and Southwest disposal sites, as well as beneficial use for beach nourishment at Half Moon Bay. The Westport Marina and the entrance channel require infrequent maintenance dredging. Annual maintenance dredging by the Corps is likely to continue for the foreseeable future. In addition, the Port of Grays Harbor (Port) conducts maintenance dredging of its marine terminal facilities adjacent to the Federal Navigation Channel (Corps 2012 – GH EA). The Corps is currently deepening the federal navigation deep-draft channel in Grays Harbor from the currently maintained depth of -36 feet MLLW to the fully authorized depth of -38 feet MLLW. The project is deepening approximately 14.5 miles of the 27.5-mile channel. The Port of Grays Harbor requested deepening the channel the additional two feet to better accommodate current vessel traffic for existing Port tenants and commodities. Maintenance dredging in Willapa Bay is currently managed by the Port of Willapa Bay. Maintenance dredging would be expected to have only negligible impacts to eelgrass associated with turbidity during dredging. The primary eelgrass impact would have occurred during the initial dredging of the project. The Port plans to dredge six locations at varying frequencies ranging from annually to every 20 years. The average annualized dredge volume they estimate is 14,000 cy (Shepsis and Chaffee 2012).
0
2
4
6
8
10
12
14
2011
2012
2013
2014
2015
2016
SP
LOP
NWP 3
NWP 35
Figure 4-8. Dredge related Corps permitting 2011-2016
88
Invasive species and control efforts
As described two invasive species, Z. japonica and S. alterniflora, may adversely affect native eelgrass.
Z. japonica occurs throughout Puget Sound, Willapa Bay, and Grays Harbor and competes for space with the native eelgrass (Z. marina). Spartina can also displace eelgrass (Zostera spp.) on mudflats although it typically occurs at higher elevations than the native eelgrass (DOI et al. 1997). Efforts to control both species with herbicides and mechanical methods are ongoing. Herbicides in particular can adversely affect the native eelgrass. These non-target effects are minimized to the degree possible.
The herbicide imazapyr and glyphosate have been used to control S. alterniflora. In Puget Sound, approximately 11.3 solid acres of S. alterniflora, including over 30,000 occurrence points, was treated in Puget Sound. This represents a seven percent increase from the 10.5 solid acres treated in 2014. It is anticipated that treatment efforts will increase in coming years (WSDA 2015). In Willapa Bay over 8,000 solid acres have been eradicated as of 2015. Affected acres in Pacific County have declined to 1,075 representing a 96 percent reduction from the peak of 25,430 affected acres recorded in 2009 (WSDA 2015). The reported amount of imazapyr discharged for Spartina control in Willapa Bay for 2012 was approximately 0.75 pound of active ingredient. In Grays Harbor S. alterniflora has been reduced to 0.0032 solid acre from a high of over ten solid acres in 2005. WSDA projects that less than 0.006 solid acre of S. alterniflora will be present in Grays Harbor County during the 2016 treatment season WSDA 2015).
In 2014, WDOE issued an NPDES permit for shellfish growers to apply imazamox to Z. japonica on clam culture beds only (not authorized for geoduck or oysters) in Willapa Bay. WDOE indicates that mixed beds of Z. marina and Z. japonica will be removed (WDOE 2014). Ecology expected that Z. marina growing off of the treatment site will not be significantly impacted if effective mitigation was employed. Follow-up monitoring indicated that effects to off-site non-target Z. marina were within the acceptable limits (WDOE 2016).
Eelgrass restoration
The Puget Sound Partnership (PSP), a state agency leading the region’s collective effort to restore and protect Puget Sound, identified eelgrass as an indicator of the health of Puget Sound in recognition of the regional ecosystem services it provides and its sensitivity to changes in environmental conditions. PSP established a goal to increase eelgrass area in Puget Sound by 20 percent relative to the 2000-2008 baseline of approximately 53,300 acres by 2020. The WDNR was subsequently tasked, in collaboration with the PSP, to develop a comprehensive recovery strategy for eelgrass. An interdisciplinary workgroup of local, state, and federal government, tribes, non-governmental organizations, and business groups defined overarching goals and prioritized implementation measures to address critical stressors and support conservation and recovery. The eelgrass recovery strategy including the following goals:
- Conserve existing eelgrass habitats and enforce the “no net loss” standard established by the SMP guidelines;
89
- Reduce environmental stressors to support natural expansion, key stressors identified included overwater structures & in-water construction, vessel mooring & anchoring, anthropogenic nitrogen and sediment loading;
- Restore and enhance degraded or declining eelgrass beds;
Successful eelgrass restoration has been difficult to achieve in Puget Sound (WDFW 2010, Thom et al. 2001, Thom et al 2014). New eelgrass beds can be established where conditions that prevent eelgrass from growing (e.g., shade, depth, substrate, or current velocity) are remedied (Thom et al. 2001, Thom et al 2014). An analysis of candidate areas for restoration was produced to support the PSP goal of increasing eelgrass area by 20%. These areas are identified in Figure 4-9.
90
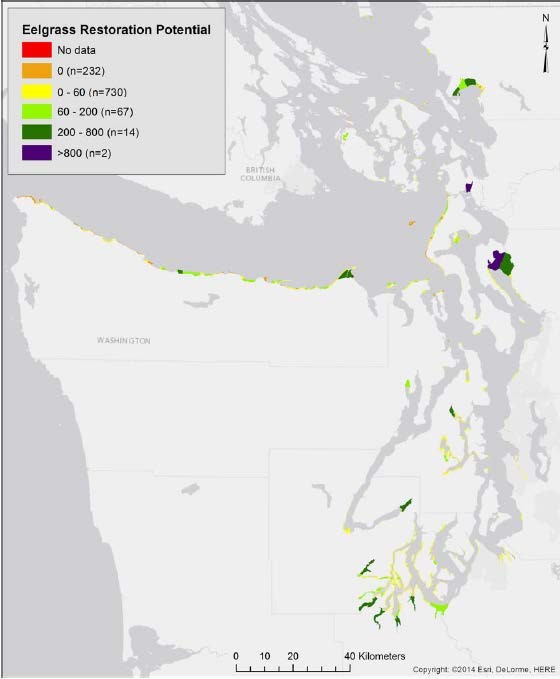
Figure 4-9. Areas identified with eelgrass restoration potential that are currently devoid of eelgrass. Higher eelgrass restoration potential score indicates greater potential (from Thom et al. 2014).
4.2.5. Effects of future actions
The population growth in Puget Sound counties combined is estimated to increase 25% between 2015 and 2040 with growth being fairly equal spread among the counties ranging from 10% in San Juan County to 36% in Whatcom County (WOFM 2012). In general the more urban areas are predicted to
91
have greater population increases than the more rural counties (Figure 4-10). The population growth in Grays Harbor County is estimated to increase 5% between 2015 and 2040 (WOFM 2012). More recent demographic data indicates that Pacific County lost population in 2015 compared to the previous year. The population growth in Pacific County is estimated to increase 6% between 2015 and 2040 (WOFM 2012). More recent demographic data indicates that Pacific County lost population in 2015.
Presently, Willapa Bay remains a rural economy will reliance on marine and resource extraction jobs. This is expected to continue. There is unlikely to be significant habitat restoration actions in the region because there are limited numbers of ESA listed species which traditionally attract restoration dollars (CRS 2007). The aquaculture industry is expected to continue to be a driving influence on the ecology of the bay.
92
Figure 4-10. Expected population growth in the counties surrounding the inland marine waters
93
Future actions were determined in part by examination of local shoreline plan updates which estimate future growth/development and other activities over a planning horizon Table 4-5. Local governments are on different update schedules. Some local governments have completed their comprehensive updates. Others are under way or have not begun.
Table 4-5. Anticipated future actions for county shoreline master plan updates
|
|
Anticipated future activities |
Source |
|
Grays Harbor County |
support expansion of agriculture, encourage expansion of aquaculture, Encourage new water-oriented commercial development, encouirage recreation development |
Preliminary Draft Grays Harbor County Shoreline Master Program August 2016 |
|
Pacific County |
future development is expected to follow the slow pace of development experienced in recent years : Tourism, recreation, residential, aquaculture, and fishing |
DRAFT Cumulative Impacts Analysis Pacific County’s Shoreline Master Program 2015 |
|
Whatcom County |
|
|
|
Skagit County |
residential development- significant in some locations; large amount of industrial property is available for potential future redevelopment |
Cumulative Impacts Analysis of Skagit County’s Shoreline Master Program 2016 |
|
Island County |
residential development, aquaculture, docks/piers limited to areas where currently clustered |
SMP update Cumulative Impacts Analysis 2013 |
|
Snohomish County |
residential infill; dock, pier, or ramp construction, bulkhead development associated with residential use; expanded agricultural use; creation of more parks/public water access sites |
Exhibit A, Amended Ordinance No. 12-025 Snohomish County Shoreline Management Program: Shoreline Environment Designations, Policies and Regulations 2012. Appendix C – Summary of Potential Development Impacts and Proposed Regulatory and NonRegulatory Offsets |
|
King County |
limited residential development |
King County Shoreline Cumulative Impacts Assessment September 2010 |
|
Pierce County |
residential development, new and reconstruction of docks/piers, limited recreational development; aquaculture |
SMP update Cumulative Impacts Analysis 2014 |
|
Thurston County |
residential development |
Final Draft Thurston County Shoreline Master Program Update Inventory and Characterization Report SMA Grant Agreements: G0800104 and G1300026 June 30, 2013 Prepared By: Thurston County Planning Department |
94
|
Mason County |
residential development |
Mason County SMP Cumulative Impacts Analysis: February 2016 |
|
Kitsap County |
residential development; limited commercial development |
Revised DRAFT Cumulative Impacts Analysis for Kitsap County’s Shoreline Master Program 2013 |
|
Jefferson County |
“residential development, master planned Resorts, marinas, co |
|
Increased development is expected to lead to increases in the impacts discussed under the previous section including increases in nutrients degrading water quality conditions for eelgrass, increases in overwater structures, increased damage from boating and anchoring. Residential development along shorelines typically involves installation of septic systems which results in nutrient addition to marine waters (Pierce CIA, Island CIA). Human-induced disturbances are expected to increase, and may exacerbate, eelgrass loss in Puget Sound (Thom et al. 2014). Efforts by the State to minimize these future impacts are likely to have some beneficial effects at reducing the rate of impact.
Aquaculture
Aquaculture is an important industry in Puget Sound, Willapa Bay, and Grays Harbor accounting for significant percentage of the nation’s shellfish production. The industry is growing and expected to continue well beyond the expiration of the 2017 NWP 48. As the industry expands, more tidelands with and without eelgrass are expected to be put into production. The effects of aquaculture on eelgrass are expected to continue into the future and would not likely cease upon the expiration of the 2017 NWP 48. One geoduck plant-to-harvest cycle can take 7 years which is beyond the 5 year timeframe of a NWP. All active and fallow acreage collocated with eelgrass would continue to impact the eelgrass or remove it entirely at least for periods of time. New areas that are put into culture may or may not be subject to restrictions on eelgrass as discussed previously.
The impacts to eelgrass from aquaculture can be temporary, depending on the activity, because the habitat conditions themselves (elevation, water quality, etc) are not permanently altered which allows eelgrass to eventually recover given sufficient time. The timeframe for recovery has been documented to be 2 to 5 years depending on the activity and other factors. This recovery timeframe may or may not allow for a full recovery of eelgrass before the next aquaculture disturbance. Even for disturbances spaced sufficiently apart, for example on a geoduck farm where geoducks are planted and covered with nets for 2 years before a 5 year period when eelgrass recovery can occur. After 5 years, geoduck harvest disturbs/removes the eelgrass once more. While this process allows for eelgrass recovery at the site, the frequency of disturbance and relatively long recovery times result in a local habitat condition where eelgrass more often than not is either not present or present at a much reduced functional state. This is the future condition of eelgrass on tidelands that are engaged in aquaculture. This effect would persist as long as aquaculture is occurring at the site. In some cases such as when nets are placed over planted clam beds, any eelgrass is likely to be permanently smothered and not recover because of the permanence of the nets which are only removed between harvest and the next planting cycle which may only be a matter of weeks or months. This is insufficient time for eelgrass to recover.
95
Construction Projects
Water clarity in nearshore areas is often reduced by the presence of suspended sediments, which can reduce the light input to eelgrass beds below that required for eelgrass growth. Studies in Puget Sound and elsewhere document that suspended sediments from land use actions can increase nearshore turbidity for extended periods (Thom et al. 2011).
A summary of all RHA Section 10 and CWA Section 404 activity permitted by the Corps in recent years is illustrated in Figure 4-11. This level of permit activity is expected to continue in the future. In most cases effects to eelgrass from these activities would avoided, minimized, or mitigated consistent with Washington State regulations.
0
20
40
60
80
100
120
140
160
180
200
2008
2009
2010
2011
2012
2013
2014
2015
2016
LOP
SP
Figure 4-11. RHA Section 10 and CWA Section 404 standard permits and LOPs for all activities 20082016
Proposed new construction projects include:
- Shell Anacortes Rail Unloading Facility. Equilon Enterprises, LLC, dba Shell (the Applicant), is proposing to construct and operate a crude-by-rail unloading facility at the existing Shell Puget Sound Refinery (PSR) in Anacortes, Washington. Each unit train arriving at the rail unloading facility would carry approximately 60,000 to 70,000 barrels of crude oil. The facility would receive six unit trains per week, with each train having up to 102 tank cars. The proposed project would not result in a change in refining capacity of the Shell PSR (EIS _Wdoes website). The project is currently being revised.
- Westway proposes expanding its existing bulk liquid storage terminal to allow for the receipt of crude oil unit trains, storage of crude oil from these trains, and shipment of crude oil and other materials by vessel and/or barge from Port of Grays Harbor Terminal 1. According to the project proposal, the Westway expansion project would be done in two phases. The information below
96
includes the proposed construction and operations for both phases. First phase would increase rail line traffic by 730 rail trips (loaded and unloaded) per year and vessel traffic in Grays Harbor by approximately 400 vessel trips per year. The second phase would increase PS&P rail line traffic by 365 rail trips (loaded and unloaded) per year and vessel traffic in Grays Harbor by approximately 120 vessel trips per year (City of Hoquiam and WDOE 2016). The proposed action is currently being revised. EIS identified potential impacts to eelgrass as a result of changes to grain size and turbidity. Increased vessel traffic may impact eelgrass on the margins of the channel
Climate change
Both sea level rise and warmer water temperatures are predicted to occur in the future as a result of climate change in Washington State (WDOE 2012). Sea level rise would result in increased depth and light attenuation may contribute to vulnerability of eelgrass and/or result in eelgrass decline at the lower edges of beds. The response of eelgrass may be to move upslope if there are suitable areas available. Although a higher sea level will probably affect eelgrass, the actual effect is very uncertain, and will interact with stressors that act upon water clarity (Thom et al. 2011). Predicted effects to eelgrass include loss of two-thirds of the low tidal areas in Grays Harbor and Willapa Bay, and increased sediment from beach erosion could impact eelgrass (WDOE 2012).
Extended periods of high temperatures reduce eelgrass growth and survival (Thom et al. 2011, WDNR 2010). In places where the water warms substantially in the summer (e.g., poorly flushed shallow bays) small increases in the temperature would result in loss of the plants. Increasing or consistently warm water temperatures in conjunction with low oxygen conditions or anoxic events may preclude growth and survival of Z. marina (WDNR 2010).
4.2.6. Summary and Conclusion
Eelgrass (Z. marina) is included in this analysis because it plays a key role in the aquatic ecosystem, is considered a protected species by the Federal government and the State of Washington, is the focus of significant restoration, monitoring, and planning initiatives, and the proposed action has substantial adverse impacts on this species.
The cumulative impacts on eelgrass are summarized in Table 4-6 for the geographic regions analyzed. Table 4-6. Summary of stressors and primary cumulative effects on native eelgrass (Z. marina)
|
stressor |
Puget Sound |
Willapa Bay |
Grays Harbor |
|
Invasive species |
Z. japonica is widespread (acreage unknown); acreage impact on Z. marina is unknown but considered limited |
Z. japonica is widespread (18,000 acres); herbicide currently used to control which has adverse effects on Z. marina where the two are collocated |
Z. japonica is widespread (4,210 acres); |
|
Nutrient driven harmful algal blooms |
nutrients and algal blooms are increasing; further increases are expected due to increased population and development; acreage impact |
significant increasing nitrate trend; effect uncertain |
no significant nutrient trends |
97
|
Suspended sediment |
historical effects likely from logging and development; increasing nearshore development may increase future suspended sediment |
historical effects likely from logging and development; some current high sediment loads documented, uncertain effects |
historical effects likely from logging and development; limited future effects |
|
Climate change |
Sea level rise may cause shifts in eelgrass up slope provided habitat is available – net effect uncertain; future increases in water temperature may reduce productivity and survival |
||
|
Overwater structures |
numerous and increasing; new standards for light penetration decrease future effects; estimated 560 eelgrass acres affected |
limited in extent |
limited to few developed locations |
|
Historical oyster harvest |
4-5,000 acres of Olympia oyster reef lost, eelgrass may have replaced to some degree although this is unknown |
6-24,000 acres of Olympia oyster reefs lost, eelgrass has colonized many of these former oyster reef areas |
Unknown |
|
Aquaculture |
widespread historical impacts; large acreages (> 4,000) potentially impacted by proposed action, and by future expected aquaculture |
widespread historical impacts; large acreages (20,000) potentially impacted by proposed action and by future expected aquaculture |
widespread historical impacts; large acreages (2,000) potentially impacted by proposed action, and by future expected aquaculture |
|
Storms |
can have large impact; eelgrass typically recovers quickly because the underlying conditions that created the habitat conditions in the first place remain the same; negligible long term impact |
||
|
Construction projects |
historical impacts; future impacts likely to be mitigated based on current regulations |
historical impacts; future impacts likely to be mitigated based on current regulations |
historical impacts; future impacts likely to be mitigated based on current regulations |
|
Boat grounding/ anchoring |
Large boating population that is increasing which suggests continued impacts; spatial extent likely limited |
Limited effects |
Limited effects |
|
Propeller wash/ boat wake |
Likely to be limited in extent |
|
|
|
Shoreline armoring |
Historical and likely continuing impacts although not clearly documented |
Some limited historical impacts likely |
Some limited historical impacts likely |
|
Dredging/ filling |
large unknown acreages lost due to historical filling and dredging; future effects likely mitigated |
||
|
Anthropogenic contaminants |
Contaminants present but effects uncertain |
No effects expected |
Contaminants present but effects uncertain |
|
Disease |
wasting disease present in Puget Sound, effects uncertain |
no known effects |
no known effects |
|
Organic matter discharge/ sulfides |
Likely historical effects due logging; uncertain effects currently but expected to be limited in extent |
Likely historical effects due to logging; future effects not anticipated |
Likely historical effects due to logging; future effects not anticipated |
98
There are historical impacts to eelgrass that are both negative and positive. Substantial losses have occurred due diking, filling, dredging, development, and pollution/nutrients. Historical aquaculture has also negatively impacted eelgrass in all of the regions. In Willapa Bay, the historical harvest and removal of the native Olympia oysters from as much as 25% of the bay allowed eelgrass to expand into this area. The extent of this change is unknown but may be in the 1,000s of acres. This likely occurred in Puget Sound and Grays Harbor as well but at a lesser scale.
Currently the primary adverse effects to eelgrass occur from urbanization/development activities and its associated pollution (primarily in Puget Sound) and aquaculture. Anticipated future impacts include urbanization/development, aquaculture, and climate change related effects. Current less developed areas in north Puget Sound and Hood Canal are expected to see some of the fastest population growth. This is also where the most extensive eelgrass beds occur in the Puget Sound.
Significance
Significance is determined by context and intensity which are defined below. With respect cumulative impacts, 40 CFR 1508.27(b)(7) states, “The following should be considered in evaluating intensity: Whether the action is related to other actions with individually insignificant but cumulatively significant impacts. Significance exists if it is reasonable to anticipate a cumulatively significant impact on the environment. Significance cannot be avoided by terming an action temporary or by breaking it down into small component parts.”
Context
A determination of significance requires consideration of both context and intensity (40 CFR 1508.27(a)). Context means that the significance of an action must be analyzed in several contexts such as society as a whole (human, national), the affected region, the affected interests, and the locality.
Nationally eelgrass has declined dramatically with 90% declines documented both along California and the Atlantic coast (NOAA 2017). It is considered a special aquatic site with protections under the CWA.
Regionally eelgrass is protected by the State of Washington under the Shoreline Management Act and
HPA regulations, and there is stated objective to increase its abundance in Puget Sound by 20% by 2020.
Locally, eelgrass conditions differ among the three geographic areas analyzed as discussed in Table 4-7. Puget Sound has more stressors acting on eelgrass and the State has identified recovery goals for the species. In Willapa Bay, the number of stressors may be less but the relative effect of individual stressors such as competition with the non-native eelgrass and aquaculture may be greater than the effect of those stressors in Puget Sound. Moreover, eelgrass in Willapa Bay may be more extensive today than it was historically, although this is uncertain, due to the large accumulations of Olympia oysters that were present and subsequently harvested. The role of eelgrass locally is also relevant as its importance may be greater if it is located at river mouths where it can provide greater benefits to certain species such as juvenile Chinook salmon. Eelgrass further from river mouths may be less valuable to this species as a rearing habitat simply due to its distance from the salmon migration pattern.
There are a number of affected interests including shellfish growers, fishing interests, salmon recovery interests, tribal communities, NGO’s, natural resource agencies, and development interests. Today shellfish growers are unique in that they are in direct competition with eelgrass and directly affect it. Historically, dredging and other construction projects also directly affected eelgrass but today these
99
types of projects are typically avoided or mitigated. Aquaculture is unique in that its impacts are not mitigated. Indirect effects of development and urbanization and degraded water quality, while likely substantial, are not yet well understood. As knowledge is gained additional restrictions may be imposed to prevent impacts. This has been the case with overwater structures which now typically are required to allow light to penetrate through the structure so as to minimize impacts to eelgrass. The other affected interests mentioned above generally support protection and restoration of eelgrass.
Intensity
The following factors should be considered when evaluating intensity (40 CFR 1508.27). These factors are discussed in the context of cumulative impacts.
- Impacts that may be both beneficial and adverse. A significant effect may exist even if the Federal agency believes that on balance the effect will be beneficial.
Beneficial effects to eelgrass have occurred in Puget Sound through restoration projects.
- The degree to which the proposed action affects public health or safety.
No public health or safety issues are identified.
- Unique characteristics of the geographic area such as proximity to historic or cultural resources, park lands, prime farmlands, wetlands, wild and scenic rivers, or ecologically critical areas.
Eelgrass itself is considered an ecologically critical area by the CWA and the State of Washington.
- The degree to which the effects on the quality of the human environment are likely to be highly controversial.
The concerns surrounding eelgrass have been extremely controversial in the State of Washington as evidenced by recent court cases specifically involving eelgrass affected by aquaculture, interest in public meetings and concerns/comment letters submitted to the Corps expressing concerns for eelgrass. Impacts associated with development also can generate controversy.
- The degree to which the possible effects on the human environment are highly uncertain or involve unique or unknown risks.
There is uncertainty with respect to all elements of the issue including the population of eelgrass itself, past, present, and future effects, and effects of the proposed action. The uncertainty is primarily about the magnitude of effect, however, as there is little debate among the scientific community about the stressors on eelgrass and effects of aquaculture in particular.
- The degree to which the action may establish a precedent for future actions with significant effects or represents a decision in principle about a future consideration.
It is uncertain whether the proposed action will set precedent for future actions; however, there is strong potential for this to occur. The 2017 NWP 48 has been issued twice previously and is likely to be issued again in 2022. Each iteration of the permit has been updated based on experiences with the previous version.
- Whether the action is related to other actions with individually insignificant but cumulatively significant impacts. Significance exists if it is reasonable to anticipate a cumulatively significant impact on the environment. Significance cannot be avoided by terming an action temporary or by breaking it down into small component parts.
100
Aquaculture represents a substantial impact to eelgrass based simply on the acreages involved. While impacts are temporary if it is assumed all aquaculture activities cease with the expiration of the 2017 NWP 48, the likely reissuance of the permit and nearly certain continuation of aquaculture beyond the permit expiration date guarantee these impacts, temporary or not, will continue well in to the future. This is further discussed below.
- The degree to which the action may adversely affect districts, sites, highways, structures, or objects listed in or eligible for listing in the National Register of Historic Places or may cause loss or destruction of significant scientific, cultural, or historical resources.
No impacts to these resources is anticipated.
- The degree to which the action may adversely affect an endangered or threatened species or its habitat that has been determined to be critical under the Endangered Species Act of 1973.
The proposed action is likely to adversely affect designated critical habitat for several species listed under the ESA including Puget Sound Chinook salmon, Hood Canal summer run chum salmon, and Puget Sound steelhead. Adverse effects are due in part to impacts on eelgrass (NMFS 2015). Recent programmatic ESA consultation concluded terms and conditions were required to protect eelgrass from aquaculture.
- Whether the action threatens a violation of Federal, State, or local law or requirements imposed for the protection of the environment.
The action does threaten a violation of State requirements under the Shoreline Management Act to achieve no net loss of eelgrass and Federal requirements to protect eelgrass imposed under the ESA for aquaculture activities. The proposed action is not consistent with either of these requirements.
Significance threshold
The cumulative impacts of past and present activities on eelgrass on an acreage basis is unknown. What is known is that eelgrass has been lost in Puget Sound. Also known is that native eelgrass is under threat in all three regions by various stressors. In Willapa Bay and Grays Harbor this is principally from invasion of non-native eelgrass, which is believed to provide many of the functions of native eelgrass, potential changes in the water temperature and sea level from climate change, and from aquaculture. In Puget Sound the list of stressors includes those just listed and also water quality and habitat changes from urbanization and development which manifest themselves in a number of ways (degraded water quality, overwater structures, mooring anchors, boat traffic).
Estimates exist for the current distribution of the species in each region. Recent trends only exist for Puget Sound and while these trends are subsamples of the total population, they are considered to reflect the status of the population as a whole. The recent trend indicates eelgrass areas have been stable. On a smaller scale, eelgrass trends are variable with some areas showing declines and others increases. The eelgrass estimates from Willapa Bay and Grays Harbor cannot be meaningfully used to examine trends because of the different methodologies used.
The determination of a significance threshold, a threshold that if reached is indicative of significant effects, is desirable in cumulative effects analysis (CEQ 1997). In the State of Washington it is evident based on the establishment of a ‘no net loss’ requirement for eelgrass that a threshold of significance has already been established in this region and that it has been reached. This is supported by WDFW (2010) which stated the following regarding eelgrass status, “The broad patterns of development and shoreline modification around the Puget Sound basin have caused small, incremental effects that have
101
become cumulatively significant”. In Puget Sound this is further supported by 1) the designation of eelgrass as critical habitat for multiple endangered species, and 2) the establishment of a goal to increase eelgrass by 20% for Puget Sound ecosystem recovery generally. Additional losses beyond this threshold would therefore be considered significant. The loss and/or degradation of potentially 1,000s of acres of eelgrass in Puget Sound alone, which is anticipated to occur under the proposed action, would thus be considered a significant cumulative impact under NEPA. There is more uncertainty with respect to losses in Willapa Bay and Grays Harbor. While the state requirement extends to these two embayments, there is substantially more eelgrass present as a percentage of estuary area, and it is possible eelgrass populations in these embayments have not experienced declines relative to historical populations. There are Federal protections including designation of eelgrass as EFH and an HAPC under the MSA and the general CWA protection of eelgrass as a special aquatic site. Given this background, it is likely that eelgrass populations in Grays Harbor and Willapa Bay can sustain losses without triggering a significance threshold. However, the loss and/or degradation of potentially 1,000s of acres of eelgrass in Willapa Bay and Grays Harbor is considerable and is likely to have ramifications for many additional species in these areas. These losses combined with the State and Federal protections, and the NEPA regulations which specifically states that significance cannot be avoid by breaking down the action into smaller parts (40 CFR 1508.27 (b)(7)), these impacts would also be considered significant.
The 2013 estimated eelgrass area is 55,870 acres in Puget Sound. The proposed action is anticipated to degrade or remove over 4,000 acres which represents 7% of this total. Over 2,600 of these acres are undisturbed by aquaculture on fallow lands. This is a large magnitude impact that is certain to occur. The magnitude of future impacts from development and climate change are unknown and less certain. In some cases the eelgrass will be replaced with oysters which provide comparable levels of productivity and function for some species such as salmon and Dungeness crab. For some species, such as herring, important functions of the habitat (i.e., spawning substrate) will be lost. In other cases, eelgrass habitat would be replaced with cover nets which provide relatively low habitat value compared to the eelgrass. Furthermore the benefits provided by oyster habitat are ephemeral because of the disturbance cycle associated with aquaculture. The eelgrass populations also decline seasonally so this may be comparable to disturbances from oyster aquaculture. The timing of aquaculture impacts are not seasonal but occur year around.
Impacts to eelgrass from aquaculture are on their surface temporary because the underlying habitat conditions (substrate, elevation, and water quality) remain the same allowing eelgrass to recover once the disturbance is removed. However, the regular disturbance associated with aquaculture both under the 2017 NWP 48 and under future permits results in a condition where eelgrass rarely recovers to its predisturbance condition. Even if full recovery is achieved, there is a substantial period of time where temporary losses of eelgrass will occur for periods of years. This temporary impact will undoubtedly have adverse effects on the species that depend on eelgrass habitat such as Dungeness crab, herring, and salmon. Loss of several years of eelgrass function at the mouth of a salmon stream for example will reduce the available rearing habitat for this species and result in fewer of that species surviving to adulthood. This would affect several year classes of that species and any fisheries on that species. In cases where the species is listed under the ESA, decreased survival of several year classes may have long term ramifications for the recovery of that species. NEPA defines significant effects as being both short- and long-term (40 CFR 1508.27(a)). The fact that effects may be temporary does not by itself exclude them from a determination of significance.
102
Given the magnitude of the impacts in acreage, the importance of eelgrass to the marine ecosystem, and the scale of the aquaculture impacts relative to other stressors, the impacts are considered significant.
4.3. Pacific sand lance and surf smelt
These species are analyzed together due to their similar life history and the similar list of stressors to the species.
The Pacific sand lance, is found from southern California around the north Pacific Ocean to the Sea of Japan, and across Arctic Canada. It is generally acknowledged to be of great ecological importance in local marine food webs (Bargmann 1998). The relative abundance of Puget Sound surf smelt, sand lance are unknown (Pentilla 2007). Greene et al. (2015) found evidence that suggested surf smelt populations in the south and central Puget Sound area have declined up to 100 fold in the last 40 years while sand lance populations have increased throughout all areas of Puget Sound during that same timeframe.
The following summaries of surf smelt and sand lance biology is from Pentilla (2007):
The surf smelt is a common and widespread nearshore forage fish throughout Washington marine waters. Spawning activity occurs in a wide variety of wave-exposure regimes, from very sheltered beaches in southernmost Puget Sound and Hood Canal to fully-exposed pebble beaches on the outer coast of the Olympic Peninsula. Spawning activity is distributed throughout the Puget Sound Basin, and stock boundaries cannot be defined geographically. Currently, about 10 percent of the shoreline of the Puget Sound Basin is documented to be surf smelt spawning habitat. Spawning regions are commonly occupied during the summer (May-August), fall-winter (September-March), or yearround (spawning every month, perhaps with a seasonal peak).
The life history of the surf smelt is intimately linked to nearshore geophysical processes. The critical element of surf smelt spawning habitat is the availability of a suitable amount of appropriately textured spawning substrate at a certain tidal elevation along the shoreline. Their potential spawning/spawn incubation zone spans the uppermost onethird of the tidal range, from approximately +7 feet up to extreme high water in central Puget Sound or the local equivalent. Spawning substrate grain size is generally a sand-gravel mix, with the bulk of the material in the 1-7 mm diameter range (Schaefer 1936, Penttila 1978).
WDFW surveys have documented surf smelt spawning habitat along 195 lineal statute miles in Puget Sound (Bargmann 1998). Their life history is unknown. There is no evidence of widespread migrations to and from the outer coast.
Sand lance, colloquially referred to as candlefish by local anglers, are also a common and widespread forage fish of the nearshore marine waters of Washington, including all of the greater Puget Sound Basin. Very little species-specific biological data are available (Field 1988). Sand lance spawning habitat has been documented in the Puget Sound Basin only since late 1989, when a protocol for detecting eggs in suitable substrate was developed (Penttila 1995a, b). Currently, about 10 percent of the basin’s shoreline has been documented as sand lance spawning habitat (Figure 6). Additional sand lance spawning beaches continue to be found during ongoing habitat survey projects (WDFW unpub. data). In
103
many instances, the spawning beaches of fall-winter surf smelt and sand lance populations overlap geographically.
Although the species are taxonomically unrelated, the spawning habitat of the Pacific sand lance generally resembles that of the surf smelt: upper intertidal beaches consisting of sand and gravel (Penttila 1995b). Their spawning sites are also similarly scattered evenly over the landscape of the Puget Sound Basin, to such a degree that hypothetical geographical stock boundaries are not apparent. Cooccurrence of eggs of the two species in the substrates is common during the winter, when the spawning seasons of Puget Sound sand lance and winter-spawning surf smelt populations overlap. The eggs of both species can be found incubating in the same substrate at the same time (Penttila 1995b). Sand lance spawning habitat attributes derive from physical forces acting on sediment in the upper third of the intertidal zone, generally between mean higher high water (MHHW) and about +5 feet in tidal elevation in central Puget Sound or local equivalent. The grain-size spectrum of typical sand lance spawning substrate can be characterized as sand, finer-grained than that of surf smelt, with the bulk of the material in the range of .2-.4 mm in diameter (Penttila 1995b; WDFW unpub. data).
Bargmann 1998: The actual spawning habitat of the Pacific sand lance was virtually unknown prior to the discovery of their spawn deposits in the upper intertidal zone of Port Gamble Bay in 1989. Systematic surveys have documented sand lance spawning habitat on 129 lineal statute miles of Puget Sound shoreline (Pentilla 1995a, 1995b, 1997). The sand lance spawning habitat survey was estimated to be about 75% complete for the Puget Sound basin prior to being reduced by budget reductions in 1997. Sand lance spawning populations on Washington’s outer coast and coastal estuaries have not been surveyed, although the occurrence of yolk sac sand lance larvae in those areas in the winter months indicates their presence.
Status
Washington State has protections in place for forage fish species as discussed below.
- The language of Washington Administrative Code (WAC) 220-110, the Hydraulic Code Rules governing hydraulic permit approvals by the WDFW, lists herring, surf smelt and sand lance spawning habitats as “marine habitats of special concern.” A “no net loss” approach is applied to these habitats.
- The WDFW Hydraulic Code Rules stipulate that the construction of bulkheads and other bank protection must not result in a permanent loss of forage fish spawning beds (WAC 220-110280(4)).
- Permissible in-water development activities are also subject to seasonal work-closure periods during local forage fish spawning seasons (WAC 220-110-271(1)). WDFW hydraulic permits granted for in-water development actions may stipulate certain measures to mitigate unavoidable forage fish habitat losses and address interruptions to beach sediment sources and movements (Pentilla 2007).
- Grounding of floats and rafts is prohibited on surf smelt, Pacific herring, and sand lance spawning beds by WDF per WAC 220-110-300 (1).
104
- The state Growth Management Act includes herring and surf smelt spawning areas as examples of priority fish and wildlife habitat conservation “critical areas”, for which there is an expectation of mapping and protective designations. This species group’s ecological importance and critical habitat vulnerability have led to their inclusion in the species and habitat lists of the WDFW’s Priority Habitats and Species Program.
- The PSP has identified a goal to remove more shoreline armoring in Puget Sound than is constructed between 2011 and 2020.
Similar to the discussion above for eelgrass, SMP guidelines under the Shoreline Management Act contain protections for forage species including sand lance and surf smelt:
- WAC 172-32-186(8) directs SMPs to “include policies and regulations designed to achieve no net loss of those ecological functions”. WDOE (2010) indicates that “the no net loss standard is designed to halt the introduction of new impacts to shoreline ecological functions resulting from new development. Both protection and restoration are needed to achieve no net loss.”
- Protecting critical saltwater habitats is important to achieving no net loss of ecological functions. The SMP Guidelines state, “Critical saltwater habitats require a higher level of protection due to the important ecological functions they provide” [WAC 173-26-221(2)(c)(iii)(A)]. Critical saltwater habitats include “…all kelp beds, eelgrass beds, spawning and holding areas for forage fish, such as herring, smelt and sandlance; subsistence, commercial and recreational shellfish beds; mudflats, intertidal habitats with vascular plants, and areas with which priority species have a primary association” (WAC 173-26-221(2)(c)(iii)(A)).
- The shoreline vegetation conservation section [WAC 173-26-221(5)] defines vegetation conservation as “activities to protect and restore vegetation along or near marine and freshwater shorelines that contribute to the ecological functions of shoreline areas.” These activities include “the prevention or restriction of plant clearing and earth grading, vegetation restoration, and the control of invasive weeds and nonnative species (WDOE 2011).
The SMP guidelines (WDOE 2015) include specific provisions for aquaculture including:
- Forage fish spawning habitat (Figure 16-5) is a critical saltwater habitat requiring protection. All aquaculture should be sited outside known forage fish (such as Pacific herring and sand lance) spawning habitat, if possible. If not possible, operating during certain work windows and conducting surveys and monitoring for forage fish activity can be used to avoid and mitigate impacts.
- SMPs should require forage fish spawning baseline surveys for new intertidal aquaculture that will occur at or near documented forage fish spawning habitat. The surveys should be conducted by trained personnel using appropriate protocols approved by WDFW. Other aquaculture permits may require a survey and Ecology recommends that proponents be allowed to submit these to meet local requirements.
- Ecology recommends that shellfish culturing be restricted to below the +5 feet Mean Lower Low Water tidal elevation if the area is documented as Pacific sand lance spawning habitat by WDFW or a site specific survey. Also, shellfish culturing should be restricted to below the +7 feet Mean
105
Lower Low Water tidal elevation if the area is documented surf smelt spawning habitat by WDFW or a site specific survey.
4.3.1. Past and present effects
Shoreline armoring
Shoreline modifications and development often negatively affect spawning sites of forage fish. A significant proportion of productive forage fish spawning habitat probably was lost in the Puget Sound basin prior to 1973 when shoreline armoring was largely unregulated (Pentilla 2007). Shoreline armoring and pollution were suggested as reasons for declining smelt population in Puget Sound by Greene et al. (2015).
Williams and Thom (2001) reviewed the potential impacts of various forms of shoreline armoring on nearshore environmental factors and resources in the Puget Sound region. Shoreline armoring may be the primary threat to surf smelt and sand lance spawning habitat (Thom et al. 1994). Armoring affects spawning habitat by physical burial of the upper intertidal zone during the course of creating or protecting human infrastructure and activities. Armoring alters the grain size making it potentially unsuitable for forage fish spawning (Dethier et al. 2016).
The sheltered bays of the inland waters so important to spawning forage fish have also been the shorelines of highest interest for commercial and residential development. Armoring also blocks, delays or eliminates the natural erosion of material onto the beach and its subsequent transport (Johannessen and MacLennan 2007). These processes maintain forage fish spawning substrate on the upper beach (Williams and Thom 2001). Although beaches may appear to be stable, their sediment is in constant motion, driven by prevailing wind and waves. The sand and gravel making up forage fish spawning substrate moves along the shoreline and eventually off into deep water, and must be replaced by new material entering the shoreline sediment transport system. A lack of a constant supply of new sand and gravel, primarily derived from eroding shoreline bluffs, may lead to coarsening, lowering of the beach elevation, and thus longterm degradation of spawning habitat.
Results of the PSNERP Change Analysis indicate that shoreline armoring occurred along 27 percent of Puget Sound (Myers 2010). The percent of armored shoreline varied considerably (9.8–62.8 percent) depending on the sub-basin. The different types of shoreline armoring and density are illustrated in Figure 4-12. Relevant to surf smelt and sand lance spawning, 27% of barrier beaches and 33% of bluff backed beaches were armored or 392 out of 1,224 miles (Myers 2010).
106

Figure 4-12. Presence of different stressors along mapped fill shoreline for Puget Sound and subbasins, expressed as a percentage (%) of fill length that stressors occupied (for example, Armoring was present along 68 percent of filled shoreline length in Puget Sound as a whole) (Strait, Strait of Juan de Fuca; PS, Puget Sound; Whidbey, Whidbey Basin) (from Myers 2010).
Recent data from Hydraulic Project Approvals (permits issued for in-water work and shoreline construction activities) indicate more armoring was gained than lost cumulatively since 2011, resulting in a net cumulative length of 1.1 miles (6,000 feet). However, in 2014, more armoring was removed than was added, a ratio that aligns well with the 2020 PSP target of no net change in armoring relative to the baseline year of 2011 (Hamel et al. 2015).
Overwater structures
Nightingale and Simenstad (2001) reviewed the potential impacts of various forms of overwater structure (e.g., docks, ramps, floats, boathouses) on nearshore environmental factors and biological resources in the Puget Sound region. The impacts on forage fishes and their critical habitats vary with the species and the size and configuration of the structure. Surf smelt and sand lance spawning habitats may persist beneath overwater structures if the structures span the spawning habitat zone, and pilings have minimal displacement of beach area, so that upper intertidal sediment distribution and movement are not affected (WDFW unpub. Data, in Pentilla 2007).
Marine Riparian Vegetation
A significant attribute of surf smelt spawning habitat may be the overhead shading provided by the canopies of mature trees rooted in the backshore zone bordering the spawning beaches. Studies have strongly suggested that the presence of shading terrestrial vegetation in the marine riparian corridor has
107
a positive effect on the survival of surf smelt spawn incubating in sand-gravel beaches in the upper intertidal zone during the summer months within the Puget Sound Basin (Penttila 2002).
Fishing
Surf smelt are recreationally and commercially important harvests for human consumption at scattered locations throughout the Puget Sound Basin. Commercial and recreational Surf Smelt fisheries each estimated at 100,000 pounds annually. The population size in Puget Sound is unknown.
Pacific sand lance have never been harvested commercially in the Puget Sound Basin, and commercial exploitation of the species has recently been banned by the Washington Department of Fish and Wildlife (WDFW), given their important ecological role. Incidental catches of sand lances are dip-netted from “bird-balls” or “bait balls” by recreational anglers during local salmon fishing seasons as a preferred sport-bait for Chinook salmon (Pentilla 2007).
4.3.2. Effects of the proposed action
The effects of the proposed action are discussed above in Section 3. They include removing spawning habitat by placement of nets, floats, barges, or other structures on spawning beaches, smothering eggs by trampling by foot or vehicle or grounding of vessels on beaches, and direct mortality of adults due to capture in aquaculture cover nets. There are no timing restrictions or monitoring associated with the proposed action that could minimize these effects.
Surf smelt and sand lance would be particularly vulnerable to cover nets installed along the shorelines because of their spawning behavior. If not dissuaded from spawning by the nets, they could be captured and killed by the nets. If they are persuaded from spawning, this habitat no longer provides the spawning function for these species.
There are currently an estimated 1,162 aquaculture acres collocated with mapped smelt and 416 acres collocated with mapped sand lance spawning habitat. GIS analysis indicates that aquaculture project areas collocated with spawning habitat extend waterward from the shoreline about 150-600 ft. Conservatively assuming each aquaculture project area extends out 400 ft waterward of the shoreline results in an estimated 109 ft of lineal shoreline per acre. This translates to totals of 24 miles (126,658 lineal ft) of surf smelt and 9 miles (45,344 lineal ft) of sand lance spawning habitat affected by aquaculture. Note this does not account for impacts that may occur to adult fish migrating along the shoreline to spawning areas that may encounter nets outside of the spawning area.
4.3.3. Effects of future actions
Development
Urbanization and development are expected continue in Puget Sound as discussed above. This results in continued shoreline armoring, overwater structures, and loss of marine vegetation.
New armoring continues to be constructed at an average pace of 0.7 miles (3,700 feet) per year (mean of 2011 – 2014), but the pace has slowed progressively since 2012. In contrast, shoreline armoring is removed at an average rate of 0.4 miles (2,200 feet) per year (Hamel et al. 2015).
Recent Corps permitting for overwater structures is illustrated in Figure 4-6.
108
State regulation administered under SMPs may minimize these effects to some degree but this is uncertain.
Aquaculture
Similar to the above discussion for eelgrass, aquaculture is certain to continue beyond the expiration of the 2017 NWP 48. The impacts described for the proposed action would thus continue into the future and likely increase as additional area is put into aquaculture production.
Fishing
Fishing for surf smelt is expected to continue.
Climate Change
Urban communities are likely to respond to sea level rise with an increase in armoring to delay the natural erosion of shorelines. This response will “squeeze” forage fish spawning beaches between rising water levels and armoring structures. USGS researchers are using models to understand the effects the “squeeze” will have on fish that rely on beaches for their survival (Liedtke 2012).
4.3.4. Summary and conclusion
The cumulative impacts on eelgrass are summarized in Table 4-7. Table 4-7. Summary of Cumulative Effects on Pacific herring
|
stressor |
Puget Sound |
Willapa Bay |
Grays Harbor |
|
Shoreline armoring |
Likely caused the greatest historical impact; shoreline armoring expected to continue, new state regulations may limit to impacts to some degree |
Limited in extent; limited future armoring |
Concentrated in certain areas; limited future armoring |
|
Overwater structures |
numerous and increasing; |
overwater structures limited to a few areas; |
overwater structures limited to few developed locations |
|
Aquaculture |
Historical impacts likely; currently an estimated 1,162 aquaculture acres collocated with mapped smelt and 416 acres collocated with mapped sand lance spawning habitat; present impacts will continue into the future |
Unknown historical impacts; no mapped spawning habitat currently |
Unknown historical impacts; very limited spawning habitat currently that is not collocated with aquaculture |
|
Fishing/ overfishing |
200,000 lbs surf smelt harvested annually; uncertain effects on population |
No known effects |
No known effects |
109
|
Climate change |
Sea level rise is may eliminate forage fish spawning habitat as beaches become compressed against the shore |
Significance
Context
A determination of significance requires consideration of both context and intensity (40 CFR 1508.27(a)). Context means that the significance of an action must be analyzed in several contexts such as society as a whole (human, national), the affected region, the affected interests, and the locality.
Surf smelt and sand lance are both broadly distributed in Washington’s marine waters but very limited is known about their life history. Their population size and structure is unknown but there is concern they are declining, at least in Puget Sound, in part due to losses of spawning habitat. Very limited study suggests surf smelt may have declined in Puget Sound, perhaps dramatically, while sand lance populations may have increased. There is virtually no information on these species in Grays Harbor and Willapa Bay. These species play an important role in the marine food web as highly nutritious prey for many predators including species listed under the ESA such as marbled murrelet and salmon species. Regionally spawning habitat is protected by the State of Washington affords some protection to spawning habitat under the Shoreline Management Act and HPA regulations.
The primary impact to these species both historically and presently is considered to be loss of beach spawning habitat due to shoreline armoring. Other activities and structures that are occur along the nearshore beach habitat such as docks and piers and aquaculture are also likely to have some impact. These impacts are expected to continue into the future. Sea level rise associated with climate change may exacerbate these impacts.
There are a number of affected interests including shellfish growers, fishing interests, salmon recovery interests, tribal communities, NGO’s, natural resource agencies, and development interests. Development and aquaculture interests generally are competing with resource agency interests over habitat protections.
Intensity
The following factors should be considered when evaluating intensity (40 CFR 1508.27). These factors are discussed in the context of cumulative impacts.
- Impacts that may be both beneficial and adverse. A significant effect may exist even if the Federal agency believes that on balance the effect will be beneficial.
Limited beneficial impacts have occurred in the form of bulkhead removal and beach restoration in Puget Sound.
- The degree to which the proposed action affects public health or safety.
No public health or safety issues are identified. Shoreline armoring provides certain protections for personal property.
- Unique characteristics of the geographic area such as proximity to historic or cultural resources, park lands, prime farmlands, wetlands, wild and scenic rivers, or ecologically critical areas.
110
Forage fish spawning habitat is identified as an ecologically critical area.
- The degree to which the effects on the quality of the human environment are likely to be highly controversial.
Impacts to forage fish spawning habitat from various impacts including development activities and aquaculture have generated much recent concern as evidenced by regulations promulgated by the state for their protection.
- The degree to which the possible effects on the human environment are highly uncertain or involve unique or unknown risks.
There is high uncertainty with respect to impacts on forage fish due simply to the very limited current understanding of the ecology and population of the species.
- The degree to which the action may establish a precedent for future actions with significant effects or represents a decision in principle about a future consideration.
It is uncertain whether the proposed action will set precedent for future actions; however, there is strong potential for this to occur. The 2017 NWP 48 has been issued twice previously and is likely to be issued again in 2022. Each iteration of the permit has been updated based on experiences with the previous version.
- Whether the action is related to other actions with individually insignificant but cumulatively significant impacts. Significance exists if it is reasonable to anticipate a cumulatively significant impact on the environment. Significance cannot be avoided by terming an action temporary or by breaking it down into small component parts.
Aquaculture and the other identified stressors represents a largely unknown impact to forage fish. These stressors do represent known impacts to habitat that is an important part of the species life history. The cumulative impacts to this habitat are substantial at present and they are expected to increase in the future. This is further discussed below.
- The degree to which the action may adversely affect districts, sites, highways, structures, or objects listed in or eligible for listing in the National Register of Historic Places or may cause loss or destruction of significant scientific, cultural, or historical resources.
No impacts to these resources is anticipated.
- The degree to which the action may adversely affect an endangered or threatened species or its habitat that has been determined to be critical under the Endangered Species Act of 1973.
The proposed action is likely to adversely affect designated critical habitat for several species listed under the ESA including Puget Sound Chinook salmon, Hood Canal summer run chum salmon, and Puget Sound steelhead. Adverse effects are due in part to impacts on eelgrass (NMFS 2015). Recent programmatic ESA consultation concluded terms and conditions were required to protect eelgrass from aquaculture.
- Whether the action threatens a violation of Federal, State, or local law or requirements imposed for the protection of the environment.
The proposed action is inconsistent with State requirements under the SMA to protect forage fish spawning habitat. The development related stressors would also be inconsistent with these requirements, although there are competing SMA requirements related to property safety that are relevant to shoreline armoring projects.
Significance threshold
The cumulative impacts of past and present activities on surf smelt and sand lance are unknown due to the lack of any population data. The determination of a significance threshold relevant to the species
111
itself is therefore not possible. Knowledge is limited to known impacts to the species spawning habitat but even here there is a fair amount of uncertainty. The geographic locations of spawning habitat are not entirely known with even less known about the species activities in Willapa Bay and Grays Harbor.
Despite this a significance threshold can be established for the known spawning habitat for the 75% of Puget Sound that has been inventoried. The State of Washington has determined that a ‘no net loss’ policy is justified for forage fish spawning habitat. The PSP has further identified a goal of removing more shoreline armoring than is placed. These actions the contention that the significance threshold has already been reached from the cumulative impacts that have occurred to date meaning that any additional impacts would be considered significant.
Currently there are 195 mapped miles of surf smelt and 129 mapped miles of sand lance spawning habitat in Puget Sound. Shoreline armoring in Puget Sound occurs on 392 out of the 1,124 miles of the beach type habitat used for spawning by these species in Puget Sound. There is substantial overlap between the mapped spawning habitat and armoring.
Aquaculture in Puget Sound affects an estimated 24 miles or 12% of the total surf smelt spawning habitat and 9 miles or 7% of the total sand lance spawning habitat. These are certainly not insignificant percentages. Coupled with likely direct mortality of adults associated with the extensive placement of cover nets throughout Puget Sound (potentially 6,000 acres), the potential for significant effects certainly exists. However, the degree to which aquaculture activities are actually collocated with spawning habitat is unknown because the culture activities typically occur lower on the beach than spawning. The exception is clam culture above the +5 ft MLLW spawning zone for sand lance. The degree to which this exception occurs is unknown. In many cases aquaculture operations could be conducted with negligible impacts on forage fish spawning that occurs on beaches immediately upslope of the culture. These farms would rarely if ever conduct activities in the upper slopes of the adjacent beach where spawning occurs. On the other hand, it is just as likely that many operations would conduct substantial activities in these upslope areas including driving vehicles, storing materials, and even culturing itself (as discussed previously in the case of sand lance). In these cases, substantial harm to spawning fish can occur or spawning areas could be removed from use by the population. The issue is really about individual husbandry practices of which there is a wide range. It is unknown if one the scenarios described above predominates. May be more important is the fact that there are no restrictions in this regard for the proposed action. It must therefore be assumed that these types of impacts will occur. The conservative approach would assume common occurrence. Given the potential for significant impacts due simply to the large acreages involved and the fact any impacts will continue well into the future, it is prudent to default to the consensus of the state scientific experts who have determined that an important threshold of cumulative effects has already been reached as described above. The conclusion therefore is that significant cumulative effects to surf smelt and sand lance spawning habitat would occur due to the proposed action.
112
5. References
Aitkin, J. K. 1998. The Importance of Estuarine Habitats to Anadromous Salmonids of the Pacific Northwest: A Literature Review. Western Washington Office, US Fish and Wildlife Service, Aquatic Resources Division. Lacey, WA.
Alcock, T. Z. and K. Bennett. 2005. Willapa Bay estuarine ranking – Preliminary geospatial data inventory. University of Washington, Olympic Natural Resources Center, Forks, WA. 31 pp.
Banas, NS, B.M. Hickey, P. Maccready, J.A. Newton. 2004. Dynamics of Willapa Bay, Washington: A Highly Unsteady, Partially Mixed Estuary, American Meteorological Society.
Banas, N.S., B.M. Hickey, J.A. Newton, J.L. Ruesink. 2005. Tidal exchange, bivalve grazing, and patterns of primary production in Willapa Bay Washington, USA. Submitted to Mar. Ecol. Prog. Ser.
Bargmann, G. 1998. Forage fish management plan. Washington Dept. of Fish and Wildlife 66 pp.
Adopted by the Washington Fish and Wildlife Commission on January 24, 1998
Blake, B and P Zu Ermgassen. 2015. The History and Decline Of Ostrea Lurida In Willapa Bay,
Washington. Journal of Shellfish Research, Vol. 34, No. 2, 273–280, 2015
Carman, R, K Taylor, and P Skowlund. 2010. Regulating Shoreline Armoring in Puget Sound, in Shipman, H., Dethier, M.N., Gelfenbaum, G., Fresh, K.L., and Dinicola, R.S., eds., 2010, Puget Sound
Shorelines and the Impacts of Armoring—Proceedings of a State of the Science Workshop, May
2009: U.S. Geological Survey Scientific Investigations Report 2010–5254, p. 11-18
Costanza, R., d’Arge, R., de Groot, R., Farber, S., Grasso, M, Hannon, B., Limburg, K., Naeem, S., O’Neill, R.V.O., Paruelo, J., Raskin, R.G., Sutton, P., and M. van den Belt. 1997. The value of the world’s ecosystem services and natural capital. Nature 387: 253-260.
Davis, W and AG Murphy. 2015. Plastic in surface waters of the Inside Passage and beaches of the Salish
Sea in Washington State. Marine Pollution Bulletin 97 (2015) 169–177
Department of the Interior, U.S. Fish and Wildlife Service, Willapa National Wildlife Refuge. 1997.
Environmental Assessment. Control of Smooth Cordgrass (Spartina Alterniflora) On Willapa
National Wildlife Refuge, Willapa Bay, Pacific County, Washington. May 1997
Dethier M, W. Raymond, A. McBride, J Toft, J Cordell, A Ogston, S Heerhartz, H Berry. 2016. Multiscale impacts of armoring on Salish Sea shorelines: Evidence for cumulative and threshold effects. Estuarine, Coastal and Shelf Science 175 (2016) 106-117
Dumbauld, B. R. and S. W. Echeverria. 2003. The influence of burrowing thalasiinid shrimp on the distribution of intertidal seagrasses in Willapa Bay, Washington. Aquat. Bot. 77:27-42.
Dumbauld, B.. J. Ruesink, K. Holsman, G. Hosack, B. Semmens, H. Tallis, H. Li, D. Armstrong, S. Rumrill, V. Poulton, D. Cheney, S. Harbell, and B. Dewey. 2004. The ecological role and potential impacts of molluscan shellfish culture in the estuarine environment. Termination Report to the Western Regional Aquaculture Center (WRAC). Reporting period: April 1st 2003-March 31st 2004. 31 pp.
EPA. 2016. Compensatory Mitigation Factsheet. https://www.epa.gov/sites/production/files/201508/documents/compensatory_mitigation_factsheet.pdf. Accessed 1-19-2016
113
EPA and Corps. 1990. Memorandum of Agreement Between The Department of the Army and The Environmental Protection Agency. The Determination Of Mitigation Under The Clean Water Act Section 404(B)(1) Guidelines
Gaeckle, J. 2016. Extent and Magnitude of Nutrient and Contaminant Concentrations in Eelgrass (Zostera marina L.) in Puget Sound. March 30, 2016. Nearshore Habitat Program, Aquatic Resources Division, Washington State Department of Natural Resources
Gaeckle, J, Lisa Ferrier and K Sherman. 2015. Spatial Evaluation of the Proximity of Outfalls and Eelgrass
(Zostera marina L.) in Greater Puget Sound. February 2015. Nearshore Habitat Program, Aquatic Resources Division, Washington State Department of Natural Resources. February 2015
Gaeckle, J. 2012. Effects of Outfalls and Effluent on Eelgrass (Zostera marina L.) Nearshore Habitat Program, Aquatic Resources Division, Washington State Department of Natural Resources. August 17, 2012
Greene, C, L Kuehne, C Rice, K Fresh, and D Penttila. 2015. Forty years of change in forage fish and jellyfish abundance across greater Puget Sound, Washington (USA): anthropogenic and climate associations. Mar Ecol Prog Ser. Vol. 525: 153–170
Hamel, N., J. Joyce, M. Fohn, A. James, J. Toft, A. Lawver, S. Redman and M. Naughton (Eds). 2015. 2015 State of the Sound: Report on the Puget Sound Vital Signs. November 2015. 86 pp. www.psp.wa.gov/sos.
Harrison, P. G. and R. E. Bigley. 1982. The recent introduction of the seagrass Zostera japonica Aschers. & Graebn. to the Pacific coast of North America. Canadian Journal of Fisheries and Aquatic Sciences 39:1642-1648.
Hallock, D., 2008. River and Stream Water Quality Monitoring Report, Water Year 2008. Washington State Department of Ecology, Olympia, WA.
Hickey, B.M. and N. Banas. 2003. Oceanography of the U.S. Pacific Northwest Coastal Ocean and Estuaries with Application to Coastal Ecology, Estuaries Vol. 26, No. 4B, p. 1010–1031
Hoquiam and Washington State Department of Ecology. 2016. Westway Expansion Project. Final Environmental Impact Statement. September. Hoquiam and Lacey, WA.
Jones and Stokes Associates, Anchor Environmental, L.L.C. and R2 Resource Consultants. 2006. Overwater Structures And Non-Structural Piling White Paper. Prepared for Washington Department of Fish and Wildlife
Krembs, C., Julia Bos, Skip Albertson, Mya Keyzers, Laura Friedenberg, Julianne Ruffner, Dr. Brandon Sackmann, Carol Maloy. 2012. POSTER: South Puget Sound 2011 and 2012 in review: Aerial and water column observations from Ecology’s long-term monitoring program. November 2012. Publication No. 12-03-052.
Krembs, C, M Dutch, V Partridge, S Weakland, J Bos, S Albertson, B Sackmann, M Keyzers, L Friedenberg, C Falkenhayn Maloy. 2014. POSTER: Changes in nutrient ratios drive changes in pelagic and benthic assemblages, and benthic-pelagic coupling in Puget Sound: A compelling hypothesis linking water quality and the benthos. Environmental Assessment Program, Washington State
114
Department of Ecology, 300 Desmond Dr., Lacey, Washington, 98504, USA. 2014. Publication No. 14-03-024. June 2014
Liedtke, T.L., 2012, Western Fisheries Research Center—Forage fish studies in Puget Sound: U.S. Geological Survey Fact Sheet 2012-3023, 2 p.
Lichvar, R.W., D.L. Banks, W.N. Kirchner, and N.C. Melvin. 2016. State of Washington 2016 Wetland Plant List. The National Wetland Plant List: 2016 wetland ratings. Phytoneuron 2016-30: 1-17. Published 28 April 2016. ISSN 2153 733X
Lönnstedt, O. and P. Eklöv. 2016. Environmentally relevant concentrations of microplastic particles influence larval fish ecology. 3 June 2016, Science 352: 1213-1216
Mach, ME, S Wyllie-Echeverria, and J Rhode Ward. 2010. Distribution and potential effects of a nonnative seagrass in Washington State Zostera japonica Workshop September 23 – 24, 2010 Friday Harbor Laboratories San Juan Island, Washington. Report for Washington State Department of Natural Resources and Washington Sea Grant.
Mohamedali, T., M. Roberts, B. Sackmann, and A. Kolosseus. 2011. Puget Sound Dissolved Oxygen
Model Nutrient Load Summary for 1999-2008. Washington State Department of Ecology, Olympia, Washington
Myers D. 2010. Shoreline Development on Puget Sound, in Shipman, H., Dethier, M.N., Gelfenbaum, G.,
Fresh, K.L., and Dinicola, R.S., eds., 2010, Puget Sound Shorelines and the Impacts of Armoring—
Proceedings of a State of the Science Workshop, May 2009: U.S. Geological Survey Scientific Investigations Report 2010–5254, p. 11-18
Nightingale, B. and C. Simenstad. 2001b. White Paper. Marine Overwater Structures: Marine Issues. University of Washington . Seattle, WA. Prepared for Washington Department of Fish and
Wildlife, Washington Department of Ecology, and Washington Department of Transportation.
PSP (Puget Sound Partnership) 2016. Comprehensive Plan . The 2016 Action Agenda for Puget Sound. Puget Sound Partnership. June 2016. 68 pp.
Roberts, M, T Mohamedali, B Sackmann, T Khangaonkar and Wen Long. 2014. Puget Sound and the Straits Dissolved Oxygen Assessment. Impacts of Current and Future Nitrogen Sources and
Climate Change through 2070. Washington State Department of Ecology Publication No. 14-03007
Simenstad, C.A., M. Ramirez, J. Burke, M. Logsdon, H. Shipman, C. Tanner, J. Toft, B. Craig, C. Davis, J.
Fung, P. Bloch, K. Fresh, S. Campbell, D. Myers, E. Iverson, A. Bailey, P. Schlenger, C. Kiblinger, P.
Myre, W. Gerstel, and A. MacLennan. 2011. Historical Change of Puget Sound Shorelines: Puget Sound Nearshore Ecosystem Project Change Analysis. Puget Sound Nearshore Report No. 201101. Published by Washington Department of Fish and Wildlife, Olympia, Washington, and U.S. Army Corps of Engineers, Seattle, Washington
Thom, R. M., A. B. Borde, S. Rumrill, D. L. Woodruff, G. D. Williams, J. A. Southard, and S. L Sargeant. 2003. Factors influencing spatial and annual variability in eelgrass (Zostera marina L.) meadows in Willapa Bay, Washington, and Coos Bay, Oregon, estuaries. Estuaries 26:1117-1129.
115
Thom, RM, J Vavrinec, JL Gaeckle, L Aston, KE Buenau, DL Woodruff, and AB Borde. 2014. Eelgrass (Zostera marina L.) Restoration in Puget Sound: Development and Testing of Tools for
Optimizing Site Selection. September 2014. Prepared for the U.S. Department of Energy under Contract DE-AC05-76RL01830. Pacific Northwest National Laboratory, Richland, Washington 99352. PNNL-23635
Von Prause, M., 2014. River and Stream Water Quality Monitoring Report, Water Year 2013. Washington State Department of Ecology, Olympia, WA.
WDNR. 2007. Overwater Structures in Marine Waters of Washington State. vector digital data. Washington State Department of Natural Resources, Aquatics Division. July 18, 2007. Online: http://geography.wa.gov/data-products-services/data/data-catalog
WDNR. 2015. Puget Sound Eelgrass (Zostera marina) Recovery Strategy. February 2015. Washington State Department of Natural Resources, Aquatic Resources Division
WDOE. 2015. Shoreline Master Programs Handbook. Chapter 16, Aquaculture. Publication No. 11-06010, December 2015
WDOE. 2011. Shoreline Master Programs Handbook. Chapter 11, Vegetation Conservation, Buffers and Setbacks. Publication Number 11-06-010. 11/28/2011
WDOE. 2012. Preparing for a Changing Climate, Washington State’s Integrated Climate Response Strategy. April 2012. Publication No. 12-01-004. 207 pp.
Washington State Department of Ecology. 2014. Final Environmental Impact Statement: Management of Zostera japonica on Commercial Clam Beds in Willapa Bay, Washington. March 26 2014. Water Quality Program
Washington Department of Ecology. 2016. Fact Sheet Addendum for the Zostera Japonica Management On Commercial Clam Beds In Willapa Bay NPDES and State Waste Discharge General Permit. Draft Permit Modification. December 7, 2016
Wise DR, Johnson HM. Surface-Water Nutrient Conditions and Sources in the United States Pacific Northwest. Journal of the American Water Resources Association. 2011;47(5):1110-1135. doi:10.1111/j.1752-1688.2011.00580.x.
WOFM (Washington State Office of Financial Management). 2012. Projections County Growth
Management Population Projections by Age and Sex: 2010-2040. Forecasting Division August 2012. 120 pp
WOFM. 2016. Population Trends. Forecasting & Research Division. Office of Financial Management. State Of Washington. September 2016. 54 pp
Wright, SL, RC Thompson and TS Galloway. 2013. The physical impacts of microplastics on marine organisms: A review. Environmental Pollution 178 (2013) 483-492
116
AQUACULTURE CUMULIATIVE EFFECTS ANALYSIS REVIEW SCHEDULE (February 2017)
|
REVIEWER and WRITER |
First Draft issued for review |
Reviewers response to comments |
Comments meeting (if needed) |
Second draft issued for review |
Reviewers response to comments |
Comments meeting (If needed) |
Finalize Document |
|
|
1 Feb |
6 Feb |
7 Feb |
9 Feb |
13 Feb |
14 Feb |
17 Feb |
|
Pozarycki |
X |
|
X |
X |
|
X |
X |
|
Harrington |
|
X |
X |
X |
|
X |
|
|
Sanguinetti |
|
X |
X |
|
X |
X |
|
|
Tillinger |
|
X |
X |
|
X |
X |
|
|
Bennett |
|
X |
X |
|
X |
X |
|
|
Walker |
|
X |
X |
|
X |
X |
|
|
McGowan |
|
X |
X |
|
X |
X |
|
|
Gesl? |
|
|
|
|
|
|
|
|
Derosa? |
|
|
|
|
|
|
|
-
In this document, underwater sound pressure levels given in units of dB RMS and dB peak are referenced to a pressure of 1 microPascal and sound pressure levels given in dB SEL (sound exposure level) are referenced to 1 microPascal2 second unless otherwise noted. ↑